Download
1 / 75
930 likes | 1.37k Views
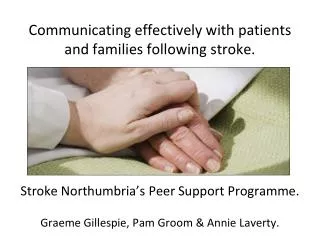
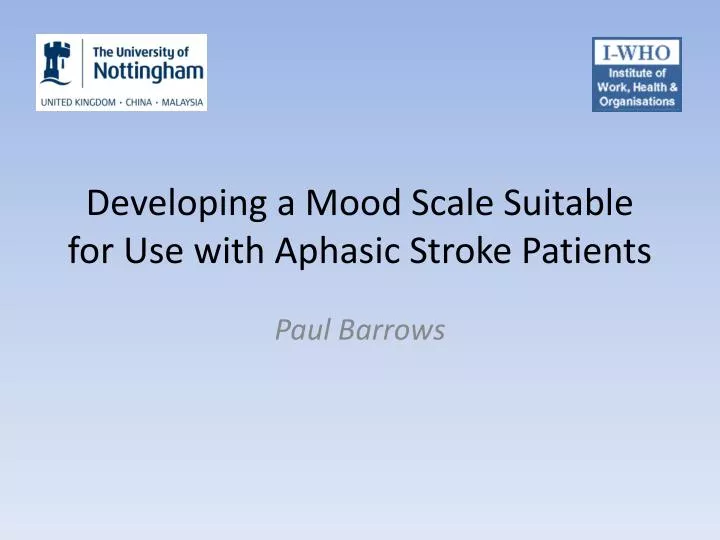
Developing a Mood Scale Suitable for Use with Aphasic Stroke Patients. Paul Barrows. Stroke. Incidence & Prevalence. In England and Wales it is estimated that 130,000 people have a stroke every year ( Office for National Statistics, 2001 ).

E N D
Developing a Mood Scale Suitable for Use with Aphasic Stroke Patients Paul Barrows
Stroke Incidence & Prevalence • In England and Wales it is estimated that 130,000 people have a stroke every year (Office for National Statistics, 2001). • There are over 1.1 million people living with stroke in the UK, but by 2020 it is expected to double, mainly due to the increasing proportion of older people (Scarborough et al., 2009).
Stroke Mortality • After heart disease and cancer, stroke is the third most common cause of death in the UK and worldwide (Warlow et al., 2003) • Stroke is responsible for over 60,000 deaths annually in the UK. (The Stroke Association, 2006) • Over the last decade, stroke has accounted for an average of around 7.5% of deaths in men and 10% of deaths in women (Office for National Statistics, 2010).
Stroke Outcome • Of those people who have a stroke, about third are likely to die within the first ten days, about third can be expected to make a recovery within one month and about a third will likely be left severely disabled (Bosanquet & Franks, 1998).
Depression after Stroke • Increased morbidity and mortality • Poorer outcomes in recovery of physical and cognitive function • Impeded recovery and longer hospital stays • Increased caregiver stress. Approximately one third of stroke survivors suffer from poststroke depression (PSD) (Hackett et al., 2005). This can lead to:
Depression after Stroke Clinical guidelines recommend screening of stroke patients, and assessment of those identified as at risk of depression (The Royal College of Physicians, 2012).
Measuring Mood in Stroke Patients Though many measures of depression and low mood exist, stroke offers challenges to assessing patients for co-morbid mental health problems. Assessment of mood in this group is problematic because: • Mood states are often masked or mimicked by neurological consequences of stroke, such as dysprosodia and dyspraxia • Impaired language and cognition – commonly in the form of aphasia – makes assessment by self-report measures problematic.
Exclusion of Aphasic Stroke Patients in Studies • A study of adaptations to measuring depression in stroke patients with aphasia revealed that 63% of studies examining PSD excluded patients whose aphasia was too severe for them to be amenable to standard measures (E. Townend et al., 2007) • Hackett and Anderson (2005) report that only 3 of 20 studies they reviewed in which predictors of PSD were examined included aphasia as a potential risk factor. This underlines an overwhelming tendency for patients with communication impairments to simply be omitted from such studies.
Stroke, Depression & Aphasia • One of the two most important predictors of immediate major depression is aphasia (p<0.001) (Astrom et al., 1993) • “Communication impairment was the greatest predictor of depression severity and prognosis” (Thomas & Lincoln, 2006) • Two-thirds of patients with aphasia met the DSM-III-R criteria for depression in the first year following stroke, a figure that was significantly higher than in those without aphasia (Kauhanen et al., 2000). Aphasia affects around 20–38% of stroke patients (E.Townend et al., 2007).
Measuring Mood in Stroke Patients Visual Analogue Mood Scales (VAMS) (Stern et al., 1997) Visual Analogue Self Esteem Scales (VASES) (Brumfitt & Sheeran, 1999) Depression Intensity Scale Circles (DISCS) (Turner-Stokes et al., 2005). Observer-Rated Self-Report • Poststroke Depression Rating Scale (PSDS) (Gainotti et al., 1997) • Stroke Aphasic Depression Rating Scale (SADQ H10/21) (Sutcliffe & Lincoln, 1998) • Aphasic Depression Rating Scale (ADRS) (Benaim et al., 2004).
Need for Screening Measures There is evidence to suggest that observer-rated scales like the SADQ-H10 and the ADRS are of clinical use (Bennett et al. 2006; Hacker et al., 2010; Benaim et al. 2010). However self-report measures have proven more problematic. There is therefore a need for self report screening tools that can more accurately assess patients in the stroke population, particularly those with communication difficulties.
Visual Analogue Self-Esteem Scale (VASES) Brumfitt & Sheeran (1999) created a 10 item, self-esteem scale for use with aphasic patients. It is made up of 10 pairs of bipolar pictures of concepts related to self-esteem, which are judged on a 5-point Likert scale below them. Often used as an indirect indicator of depression. Brumfitt & Sheeran (1999)
The Depression Intensity Scale Circles (DISCs) Essentially a Likert Scale, but using black disks of increasing size to enable cognitively impaired patients to quantify their mood state more easily. Turner-Stokes et al. (2005)
Visual Analogue Mood Scales (VAMS) Stern et al. (1997) developed a set of 8 VAS-based mood scales in pictographic form. Happy, Sad, Energetic, Tired, Angry, Afraid, Tense,Confused. • Each is comprised of two cartoon faces at either end of a 100mm line. The user indicates their mood by making a mark along the length of the line. VAMS ‘Sad’ Item
Visual Analogue Mood Scales (VAMS) VAMS validated in several populations, including stroke and dementia patients (Stern et al. 1997; Arruda et al. 1999; Temple 2004). However: • Researchers report patients being ‘bewildered’ by the VAMS (Townend et al., 2007). • Though VAMS offers a broad measure of severity of depression, it is of little use as a screening instrument (Bennett et al., 2006) • “The use of Visual Analogue Mood Scales amongst patients with aphasia {...} cannot be recommended.” (Berg et al., 2009).
Visual Analogue Mood Scales (VAMS) • Typically, studies use only a single VAMS scale – the ‘sad’ item – to assess mood • VAMS are separate, single-item scales, so a combined total score is not possible • VAMS not underpinned by any theory of mood • Evidence suggests that stroke patients with cognitive impairments cannot use VASs effectively (Price et al., 1999).
1a. Using Photos Of Human Faces Why use Human Faces? • Facial expression is arguably the most powerful, universal communicator of mood states (Ekman, 1971, 1993) • Photographs of actual emotional expressions offer a more nuanced, detailed and accurate portrayal of mood states • “...use of realistic looking pictures {...} may usefully support communication about mood with people with aphasia”– Townend et al (2007) VAMS ‘Sad’ Item Study Participant
1b. Using Photos Of Human Faces Why use Human Faces? • Aphasia can impact upon a person’s ability to decode symbols, such as those in written language, and this may also affect their ability to recognise such graphics • Evidence suggests that recognition of emotion in facial expressions occurs primarily in the right hemisphere (Adolphs et al., 1996; Philippi et al. 2009). Most aphasic patients have left hemisphere lesions, therefore affect recognition in faces is unlikely to be affected.
2a. Explicit Structural TheoryThe Valence-Activation Model of Affect Larsen & Diener (1992)
2b. Explicit Structural TheoryUsing Scales Across 2-factor Affect Space Larsen & Diener (1992)
2b. Explicit Structural TheoryUsing Scales Across 2-factor Affect Space
2b. Explicit Structural TheoryUsing Scales Across 2-factor Affect Space
2b. Explicit Structural TheoryUsing Scales Across 2-factor Affect Space
2b. Explicit Structural TheoryUsing Scales Across 2-factor Affect Space
Cognitive Interpolation Scale Maximum Reference State ? Scaled Result Scale Minimum
Explicit Interpolation Dynamic Visual Analogue Scale (DVAS) Reference State A slider control dynamically animates a picture to explicitly anchor points of the scale to transitional images
Explicit Interpolation Dynamic Visual Analogue Scale (DVAS) Reference State A slider control dynamically animates a picture to explicitly anchor points of the scale to transitional images
Explicit Interpolation Dynamic Visual Analogue Scale (DVAS) Reference State A slider control dynamically animates a picture to explicitly anchor points of the scale to transitional images
Explicit Interpolation Dynamic Visual Analogue Scale (DVAS) Reference State A slider control dynamically animates a picture to explicitly anchor points of the scale to transitional images
Explicit Interpolation Dynamic Visual Analogue Scale (DVAS) Reference State A slider control dynamically animates a picture to explicitly anchor points of the scale to transitional images
Study 1Part 1 – Producing a Suitable Set of Photographs Objectives • To select and test a pool of mood words for their ability to evoke recognisable facial expressions, based on which a smaller pool of candidate descriptors will be selected for further study • To confirm that judgments of facial expression are consistent with a two-factor, circumplex model of affect, and to establish a coordinate system for mood words and corresponding expressions • To identify ‘actors’ who are good at producing recognisable facial expressions, and whose photos may be candidates for the final scales.
Study 1Part 1 – Producing a Suitable Set of Photographs Study 1 - Three Parts • Producing a suitable set of photographs representing a range of candidate mood words • Judging the photographs • Eliminating weaker items, and identifying candidate mood words/faces for the final scales
Study 1Part 1 – Producing a Suitable Set of Photographs Part 1 – Producing a Suitable Set of Photographs Participants Gender: 10 male, 10 female (n=20) Age: mean 20.6 years; S.D. = 1.7 years English: 12 (60%) spoke English as a first language, 8 (40%) spoke English fluently as a second language. Ethnicity: 12 (60%) were ethnically European, 6 (30%) were Asian or East Asian and 2 (10%) were of African descent.
Study 1Part 1 – Producing a Suitable Set of Photographs Part 1 – Producing a Suitable Set of Photographs Methods Recruitment: Advertisements posted about University of Nottingham and Community Centres Selection criteria: >18 years; fluent in English; have no facial hair, tattoos; capable of posing facial expressions Incentive: £10 for session up to approx 1 hour Task: Participants photographed posing expressions based on 26 mood words.
Study 1Part 1 – Producing a Suitable Set of Photographs Part 1 – Producing a Suitable Set of Photographs Methods Stimulus words 26 mood words from previous research in the area which: 1) span circumplex well, 2) represent persistent mood states, and 3) include items used in VAMS.
Study 1Part 1 – Producing a Suitable Set of Photographs Part 1 – Producing a Suitable Set of Photographs Results Photographs: Total of 1,560 photographs taken of 20 ‘actors’ posing 26 mood states (3 photos each). Pre-screening: ‘Best of three’ task independently completed by experimenter and 2 staff. 520 (20 x 26) photographs selected for final pool.
Study 1Part 1 – Producing a Suitable Set of Photographs Part 1 – Producing a Suitable Set of Photographs Results 26 Posed Moods
Study 1Part 1 – Producing a Suitable Set of Photographs Part 2 – Judging the Photographs Participants Gender: 21 male, 23 female (n=44) Age: mean 24.6 years; S.D. = 6.2 years English: 25 (56%) spoke English as a first language, 20 (44%) spoke English fluently as a second language. Ethnicity: 15 (33%) were ethnically European, 25 (56%) were Asian or East Asian, 2 (4%) were of African descent and 3 (7%) were mixed race.
Study 1Part 1 – Producing a Suitable Set of Photographs Part 2 – Judging the Photographs Methods Recruitment: Advertisements posted about University of Nottingham campus Selection criteria: >18 years; fluent in English Incentive: £4 per dataset Task: Online judgement task. Each of 26 photographs judged on 26, 7-point Likert scales corresponding to the stimulus mood words.
Study 1Part 1 – Producing a Suitable Set of Photographs Part 2 – Judging the Photographs Methods Data Collection Project portal website and database created to manage data collection at www.xvams.com. 100 (26x26) datasets collected (n=44), Total of 67,600 judgements. *XVAMS = Extended Visual Analogue Mood Scales.
Study 1Part 1 – Producing a Suitable Set of Photographs Part 2 – Judging the Photographs Results A principle component analysis demonstrates a clear, 2-factor solution (Eigenvalue cut-off 1.75–2.4). Factor 1 identified as valence (70%). Factor 2 identified as activation (20%).
Study 1Part 1 – Producing a Suitable Set of Photographs Part 2 – Judging the Photographs Results Plot of factor loadings yields clear evidence of circumplexical structure, with mood words following predicted pattern.
Study 1Part 1 – Producing a Suitable Set of Photographs Part 2 – Judging the Photographs Results Examination of correlation matrix and S.D. values identified stronger items that could be retained for Part 3. Energetic Disappointed Calm Confused Pleased Tense Bored Sleepy Excited Angry Tired Content Happy Nervous Miserable Peaceful Enthusiastic Distressed Depressed Neutral Sad Anxious Satisfied Afraid Aroused Relaxed
Study 1Part 1 – Producing a Suitable Set of Photographs Part 2 – Judging the Photographs Results Examination of correlation matrix and S.D. values identified stronger items that could be retained for Part 3. Satisfied Afraid Sad Sleepy Happy Angry Miserable Calm Excited Distressed Bored Peaceful
Study 1Part 1 – Producing a Suitable Set of Photographs Part 3 – Judging the 12 Item Photograph Subset Repeat of Part 2, with 12 Item Subset • After eliminating weaker items, results should be more accurate • Smaller datasets mean more images sets can be completed (5 sets instead of just one); many more datasets per actor required to allow comparison • 44% of Part 2 participants spoke ESL. Higher proportion of native English speakers desirable • Most were students at Nottingham, need more geographically diverse for external validity.
Study 1Part 1 – Producing a Suitable Set of Photographs Part 3 – Judging the 12 Item Photograph Subset Participants Gender: 38 male, 26 female (n=64) Age: mean 33 years (18–72 years); S.D. = 14.8 years English: 53 (83%) spoke English as a first language, 11 (17%) spoke English fluently as a second language. Ethnicity: 46 (72%) were ethnically European, 6 (9%) were Asian or East Asian, 1 (2%) was of African descent and 3 (5%) were mixed race.