Download
1 / 63

E N D
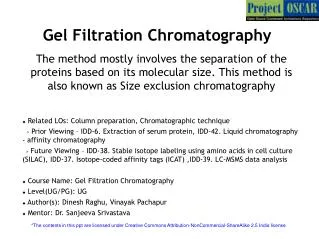
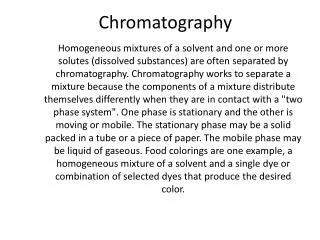
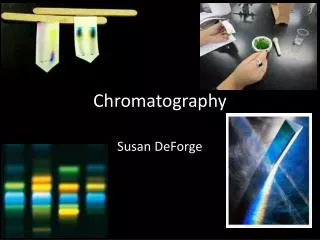
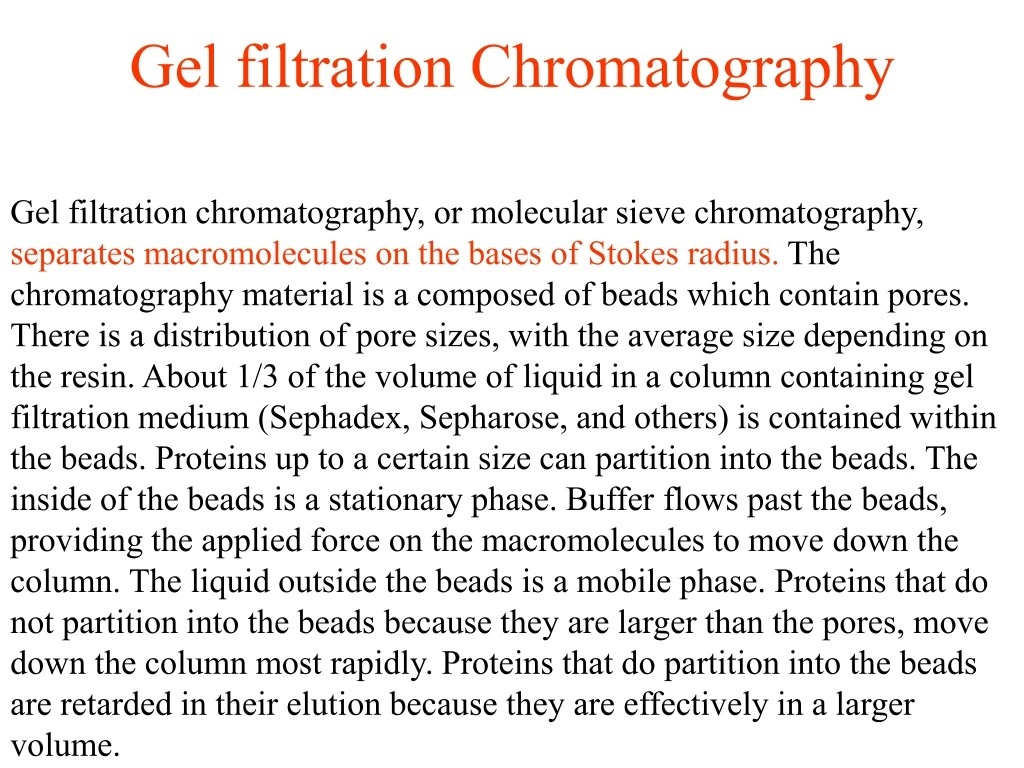
Gel filtration Chromatography Gel filtration chromatography, or molecular sieve chromatography, separates macromolecules on the bases ofStokes radius. The chromatography material is a composed of beads which contain pores. There is a distributionof pore sizes, with the average size depending on the resin. About 1/3 of the volume of liquid in a columncontaining gel filtration medium (Sephadex, Sepharose, and others) is contained within the beads. Proteins up toa certain size can partition into the beads. The inside of the beads is a stationary phase. Buffer flows past thebeads, providing the applied force on the macromolecules to move down the column. The liquid outside the beadsis a mobile phase. Proteins that do not partition into the beads because they are larger than the pores, move down the column most rapidly. Proteins that do partition into the beads are retarded in their elution becausethey are effectively in a larger volume.
Ve - Vo VI - Vo = Gel filtration chromatography Fap = solvent flow Fret = partitioning into stationary phase particles small molecules partition into beads - This retards their progress down the column Large particles are excluded from the bead interior -elute faster Measure elution volume, Ve, or Vo = elution volume of totally excluded molecules VI = elution volume of totally included molecules beads -stationary phase matrix solvent flow VoVeVI elution volume measure particle velocity solvent velocity
Ve - Vo VI - Vo = Gel Filtration Chromatography depends on size and shape- 0.9 0.1 accessible volume within the matrix small molecule large molecule Proteins that are excluded from the interior of the beads elute at the excluded volume (Vo), whereas smallmolecules define the opposite extreme, the totally included volume (VI). The difference, (VI-Vo) is the volume insidethe beads. The elution volume of an molecule will be in between the Vo and VI. The degree to which the molecule of interest has access to the interior of the beads is measured as σ, defined above.
The elution volume accurately measures the Stokes radius of a macromolecule. Experimentally, the value of σ or the elution value, correlates with the Stokes radius as measured by otherhydrodynamics techniques. The same factors of size and shape that result in altered frictional drag throughsolution also determine the ease of penetration of a molecule into the bead interior in gel filtration media. Often gel filtration is calibrated using standards of known molecular weight and calibrated in terms of molecularweight rather than Stokes radius. This will be accurate only if all the standards as well as the unknown samplehave the same shape and specific volume, as we described for the interpretation of sedimentation data. Hence,globular, spherical proteins can be used as a set of standards, but if the unknown protein has an elongatedshape it will not penetrate the beads, and will have a large Stokes radius. If the gel filtration data are calibratedin terms of molecular weight, the answer obtained by gel filtration will be much too large, since the elongatedmolecule behaves as a much larger sphere.
Example: Elution of native globular protein using Sephadex G-200 1 0 3.0 2.5 2 1.5 1.0 cyt c BSA catalase Ve Vo blue dextran Vo 104 105 106 Log(Molecular weight) Experimentally, the retardation of macromolecules in gel filtration chromatography correlates very well with the Stokes radius measured by Diffusion If standards and the unknown have the same shape then- and only then- does gel filtration chromatography give a good estimate of molecular weight sucrose VI totally included globular (spherical) proteins totally excluded
The previous graph shows a plot of the elution volume of a series ofglobular proteins over a wide range of molecular weights for the medium Sephadex G-100. Often such graphs areused to calibrate a column and then used to obtain M for an unknown protein. This is incorrect, however,because of the unknown shape factor. Since any deviation from spherical shape will result in an increase in theStokes radius, it can be concluded that any molecular weight obtained by such a method is a maximum value.
Active Transport in E. coli Mediated by outer membrane proteins and TonB Example: the FhuA transport Protein from E. coli -active transport system coupled To TonB in the cytoplasmic membrane -required for ferric ion transport via ferrichrome complex Science (1998)282,2202-
Express and characterize TonB without the N-terminal membrane anchor put a His-tag on the N-terminus to facilitate one-step purification H6-’TonB Protein is soluble Calculated molecular weight: 24,880
Size Exclusion Chromatography of H6-TonB use Superose 12 column Total volume: 21 ml measured by the elution of NaNO3 Void Volume: 7.3 ml measured by the elution of Dextran blue 2000 Calibrate vs Rs thyroglobulin Rs = 8.6 nm; Ve = 8.8 ml ferritin Rs = 6.3 nm; Ve = 10.7 ml catalase Rs = 5.2 nm; Ve = 11.7 ml aldolase Rs = 4.6 nm; Ve = 12.0 ml bovine serum albumin Rs = 3.5 nm; Ve = 12.5 ml ovalbumin Rs = 2.8 nm; Ve = 13.4 ml chymotrypsinogen Rs = 2.1 nm; Ve = 14.9 ml RNase Rs = 1.75 nm; Ve = 15.5 ml Journal of Bacteriology, May 2001, p. 2755-2764, Vol. 183, No. 9
Size Exclusion Chromatography of H6-TonB Rs = 4.1 nm for H6-TonB Journal of Bacteriology, May 2001, p. 2755-2764, Vol. 183, No. 9
Sedimentation Velocity of H6-TonB Measure S20,w = 1.4 S Calculate M = 1.007 g/ml = 1.04 Poise V = 0.7376 ml/g (from sequence) Rs = 4.1 nm (from gel filtration) Rs = M(1 - V)/6NS20,w M = 28,000 Conclude that H6-TonB is a monomer in solution
Sedimentation Equilibrium of H6-TonB 0.8 mg/ml protein 18000 rpm overnight 20oC M = 30,000 Slope = M(1-V) = 1.007 g/ml V = 0.7376 ml/g Conclusion: H6-TonB is a monomer in solution consistent with gel filtration/Sed. velocity Journal of Bacteriology, May 2001, p. 2755-2764, Vol. 183, No. 9
Size Exclusion Chromatography of H6-TonB Rs = 4.1 nm for H6-TonB Calculate Rmin = (3MV/4N)1/3 = 1.9 nm for anhydrous sphere with M = 24,900 from sequence Conclude: molecule is highly asymmetric Rs/Rmin = 2.1 Journal of Bacteriology, May 2001, p. 2755-2764, Vol. 183, No. 9
One can re-calculate Rmin assuming hydration of 0.3 g H2O/g protein Rmin = 2.0 nm so Rs/Rmin = 2 Consistent with an ellipsoid with an axial ratio of 15:1 240 Å x 16 Å TonB goes from the inner to the outer bacterial membrane
FhuA: an integral outer membrane protein From E. coli -22 b strands in blue -“cork” domain in yellow -Bound to Fe 3+ferrichrome Energy-driven conformational change drives Fe transport Science (1998)282,2215-
Size Exclusion Chromatography of FhuA Rs = 4.8 nm for FhuA TLN buffer contains detergent,some of which is bound to the membrane protein to maintain the protein in solution consistent with protein plus bound detergent: Mr = 185,000
Mixture of FhuA and TonB Elutes at a Smaller Volume in the presence of the FhuA Fe ligand plus ferricrocin: Rs = 6.2 nm no ferricrocin Assuming a 1:1 Complex, Rmin can be estimated as 4.4 nm so Rs/Rmin = 1.4 for the presumed complex. This is more typical of globular proteins and much less asymmetric than TonB alone Journal of Bacteriology, May 2001, p. 2755-2764, Vol. 183, No. 9
Electrophoresis The next (third) mass transport technique we will discuss is electrophoresis. In this case the applied force is due to theelectric field. This will be dependent on the net charge on the macromolecule. In solution, without any retardingmatrix such as polyacrylamide or agarose, the force of retardation would be proportional to the frictional coefficient or Stokes radius. The electrophoretic mobility is the velocity per unit of electric field, related to the (Q/f) or (Q/Rs). Since theelectrophoretic mobility depends on both charge and size, it cannot be interpreted in any simple manner. A folded protein, for example, might have a net positive or negative charge and, therefore, might travel towardseither the anode or cathode. Furthermore, the effective charge is going to be dependent on the ionic compositionin solution, making this an even more complex problem.
Electrophoresis applied force: electrical field retarding force: frictional drag moving through solution Fap Fret= f•(velocity) Fap = Q•E charge x electric field in steady state: f•(velocity) = Q•E electrophoretic mobility: U = = ( ) velocity Q E f depends on charge (Q) and Rs However, usually electrophoresis is done in the presence of a retarding matrix such a polyacrylamide The ability of a macromolecule to move through the retarding matrix depends on the Stokes radius
A commonly used retarding matrix is cross-linked polyacrylamide Dilute polymer solution Concentrated solution Gel The practical solution to obtaining useful information inthe most straightforward manner is to force the migrating molecules to pass through a retarding matrix (agarose,polyacrylamide). These crosslinked polymericsubstances make a mesh though which themacromolecule mustpenetrate. The ease with which a molecule can pass through this matrix correlates with the Stokes radius of themolecule.
- Electrophoresis in a retarding matrix such as agarose or polyacrylamide log U = log Uo - KR (%T) Experimentally, the electrophoretic mobility is dependent on the percent of acrylamide (%T), and the retardationcoefficient is a measure of the extent of this dependence. percent acrylamide measured mobility mobility in absence of gel ( depends onQ and Rs) retardation coefficient Depends only on Rs (size and shape) The valueof the electrophoretic mobility is Uo. The crucial element is that the retardation coefficient, which describes theextent to which the acrylamide matrix itself retards the motion of the macromolecule, depends only on the Stokesradius and not on charge. - no matrix Uo U matrix + +
Electrophoresis of native proteins log U = log Uo - KR.(%T) Uo is different for each protein since it depends on both Q and Rs Since the retardation coefficient KR depends only on Stokes radius and not on charge, one can obtain Rs by determining KR Measure the electrophoretic mobility vs % acrylamide the slope gives KR which can be calibrated in terms of Stokes radius this is called a Ferguson Plot For native, folded proteins, one can obtain the retardation coefficient by measuring the electrophoretic mobility(essentially, how far a protein migrates in a given time) in a series of different polyacrylamide gels of differentpercentage. The higher amount of acrylamide results in a finer mesh that the protein must penetrate. Thisresults in a smaller electrophoretic mobility. A plot of % acrylamide versus U is called a Ferguson plot, and theslope of the line obtained gives the retardation coefficient for a particular protein.
Ferguson Plot to determine the Stokes radius of non-denatured protein log U = log Uo - KR (% T) Uo - depends on Q and Rs KR - depends only on Rs KR = retardation coefficient (%T) = % acrylamide Ferguson Plot non-denatured proteins If standards and the unknown protein have the same shape then the Rs is related to M fast slow unknown increasing Rs slope log U 0 10,000 30,000 50,000 M 0 1 5 10 % acrylamide ? slope Rs M if standards and unknown have same shape
Estrogen Receptors Detect receptor on gel by binding assay (radiolabeled estrogen analog) Do NOT need pure material can convert Rs M only if the shape is assumed to be spherical
Example of the Application of the Ferguson Plot GOAL: To determine the subunit composition of bacterial dioxygenases of potential use in environmental cleanup of polychlorinated biphenyls (PCPs) purified enzymes contain two kinds of subunits, analyzed by SDS polyacrylamide gel electrophoresis. subunit subunit J. Biol Chem (2001)276,29833-38
Two enzymes were examined which have distinct substrate specificities. In addition, a hybrid enzyme was prepared and examined. SDS-PAGE: gives subunit molecular weight and approximate ratio Relative staining intensities are consistent with 1:1 ratio of the two subunits lane 2. biphenyl dioxygenase A1 = subunit A2 = subunit lane 3. hybrid C1 = subunit A2 = subunit (~50KDa) lane 4. toluene dioxygenase C1 = subunit C2 = subunit (~21 KDa) J. Biol Chem (2001)276,29833-38
Ferguson Plot Analysis of dioxygenases 1. for each protein (called “ISPxx”), determine the mobility (Rf) as a function of percent acryamide (%T) 2. Determine the slope (Kr) of the plot of logRfvs %T 3. Plot logKr (slope) vs log (mol wt) 4. If standards and dioxygenases are the same shape, then molecular weightcan be determined. If the unknowns are highly asymmetric, the molecularweight will be incorrect.
Conclusions from Ferguson Plot anaylysis 1. biphenyl dioxygenase is a hexamer: 3 3 2. toluene dioxygenase is a tetramer: 2 2 3. hybrid enzyme is a hexamer: 3 3 J. Biol Chem (2001)276,29833-38
Electrophoresis of double stranded DNA of denatured RNA (no secondary structure) of SDS - protein complexes Within each set: (1) shape is the same (2) charge and size vary proportionally Uo does not vary with molecular weight Uo = Q offsetting effects f Hence, in comparing (for example) DNA samples, U varies in proportion to Stokes radius - No need to vary % acrylamide , so one gel is sufficient log U = log Uo - KR (%T)
Electrophoresis of SDS-Protein Complexes The procedure of using the Ferguson plot requires running a number of separate gelssince the percent of acrylamide must be varied. Furthermore, the unknown shape factor makes it risky tointerpret the results directly in terms of molecular weight. The strategy employed to simplify and improve theusefulness of electrophoresis is to use dodecyl sulfate (SDS) to denature the proteins, and then determine the electrophoretic mobility of the SDS-protein complex. In many cases, this allows one to obtain a reasonablyaccurate molecular weight of the polypeptide by running only one gel. Why does this work? There are tworeasons.
1. The SDS complex results in the unfolding of the polypeptide, with about 1.4 grams of SDS bound pergram of protein. The complex is very highly asymmetric, like a chain which is covered with the negatively charged SDS. Larger proteins essentially form longer chains. The longer chains have both more charge(Q) and a larger frictional coefficient (f or Rs), and these two have offsetting effects on the value of Uo. Hence, in the absence of the polyacrylamide retarding matrix, all protein-SDS complexes will run with thesame electrophoretic mobility. 2. The SDS-protein complexes all have the same shape. Hence, there is a uniform relationship betweenthe Stokes radius and the molecular weight for all (with exceptions) proteins. Hence, KR really does vary with molecular weight.
Constant value of Uo for SDS-Protein Complexes allows the Rs to be determined by the electrophoretic mobility on a single gel and comparing to standards fast slow increasing Rs 0 1 5 10 % acrylamide Only one gel is Needed to get Rs Cannot get Rs from A single gel SAME UO increasing Rs log U 0 1 5 10 % acrylamide NATIVE PROTEINS SDS-PROTEIN COMPLEXES Since the SDS-Protein complexes all have the same shape: Rs correlates well with molecular weight (M)
Electrophoresis of Protein - SDS Complexes - - - - - - - - - - - - -highly asymmetric -as length of protein increases, so does Q log U = log Uo - Kr (%T) Uo is the same for all complexes relative mobility depends on Rs only since the shape is the same for all complexes Rs Molecular Weight Problems with SDS-PAGE: one can get incorrect answers! -Uo might be different for unknown and for the standards 1. Membrane proteins (run fast) 2. Glycoproteins (run slow) -more or less SDS bound: so (Q/f) is not the same (usually 1.4 g SDS / g protein for a typical soluble protein) -glycoproteins can have substantial carbohydrate component that does not bind SDS -shape may not be same due to incomplete unfolding (membrane proteins)
There are two major classes of proteins that present problems with this approach. 1) Membrane proteins are veryhydrophobic and may not unfold completely, even in the presence of SDS. Furthermore, the very hydrophobicnature of the side chains may result in abnormal (excess) binding of SDS. Hence, the assumption that Uo is thesame for the unknown as for the standards may not be correct. These effects cause hydrophobic membraneproteins to run faster in SDS-PAGE than they should. As a result, the molecular weights are oftenunderestimated very significantly. 2) The second class of proteins that don’t behave similarly as the standards forcalibration, are glycoproteins. These have covalently attached carbohydrate residues, which interfere with thebinding to SDS. Hence, glycoproteins usually run slower than they would do otherwise in SDS-PAGE and themolecular weights are overestimated.
SDS-PAGE of Purified H6-TonB Gives an incorrect value of the molecular weight Expected molecular weight: 24.9 kDa Estimated Mr from SDS-PAGE Mobility: 35 kDa same as wild type TonB reason is not known Journal of Bacteriology, May 2001, p. 2755-2764, Vol. 183, No. 9
Chemical Crosslinking of FhuA and His6-TonB Shows the presence of a 1:1 Complex Enhanced by ferricrocin and inhibited by 1 M NaCl Journal of Bacteriology, May 2001, p. 2755-2764, Vol. 183, No. 9
Electrophoresis of Small Double Strand DNA and of RNA It is standard procedure to separate linear, double strand DNA species according to the number of basepairs bypolyacrylamide or agarose electrophoresis. Only a single gel is necessary, and given standards run along side ofan unknown, to determine the molecular weight (or number of basepairs) of DNA. The reason this can be done isthe same as with SDS-protein complexes. 1. Different lengths of DNA all have the same value of Uo since both charge and size vary proportionately. 2. All the DNA molecules have the same shape if they are linear, so the Stokes radius varies inproportion to the number of basepairs. This will not work if the DNA is circular or supercoiled. These arguments do not hold for RNA, which has considerable tertiary structure. Hence, the molecular weight ofnative RNA cannot be determined as for DNA, but presents the same complications as native, folded proteins. Asa result of this it is necessary to denature RNA during the electrophoresis. Using alkaline conditions, or solventslike dimethylformamide, which disrupt the tertiary structure and secondary structure of RNA. Under theseconditions, as with double strand DNA, and as with SDS-protein complexes, the only difference between RNAspecies that results in different electrophoretic mobilities is the length of the RNA strand.
Electrophoresis of double-strand DNA log U = log Uo - KR (%T) constant Relative mobility in gel Rs # basepairs Uo constant Same shape for unknown and standards compare with standards Whenever you have secondary structure this approach fails 1. Uo need not be the same for unknown and standard set 2. Rs will not simply be related to # basepairs (or mol wt) if the shape of the unknown is not the same as the shape of the standard set -Hence, one needs to denature RNA to obtain the correct molecular weight from a single gel.
Stacking of the Sample in Electrophoresis Electrophoresis is a zonal method, in which the sample is layered on top of the separating retarding matrix andthe mobility is measured by observing the migrating band of material. Hence, it is important to have a narrowband of material to optimize the resolution of the technique. Stacking is used to produce a very sharp band ofmaterial prior to entering the separating gel. The procedure is shown below.
sample buffer Stacking and Discontinuous Gels Zonal analysis depends on having sharp, well defined bands 1 create a large electric field (voltage drop) in the sample buffer to concentrate the protein prior to separation by the gel - want large Electric Field to rapidly pile up protein at the surface of the gel. +
The logic 1. The charges moving through the gel constitutes the current in the presence of the applied voltage. Theflux of charges across any reference plane through the gel must be the same. 2. The flux (J) of ions of any particular type is the product of the concentration of the ionic speciesmultiplied by the net velocity of the ions. 3. The electrophoretic mobility of each ion is different and is defined as the ion velocity per unit electricfield (U= V/E). 4. This leads to the basic equation that J1=C1U1E1=C2U2E2=J2
This means that at places in the gel where either the concentration or the mobility of the major charge carrier islow, the result is a high electric field. This just means that where the resistance to current flow is high, there willbe a large voltage drop (meaning a large electric field). In the Laemmli buffer system, used routinely for SDSPAGEsystems, there is a discontinuous buffer (hence, disc-gel electrophoresis). Glycine is the major buffer in thesample, and the pH is such that the average charge is low on the glycine, reducing its electrophoretic mobility (U1in the next slide). Chloride is the major ionic carrier of charge in the gel itself. As a result of the electricresistance due to the low mobility of glycine, the electric field across this part of the system is very high (E1). Thisis where the protein is loaded, so the SDS-protein complex is subject to this very large field, which causes thecomplexes to move rapidly down, where all the proteins pile up on top of the separating acrylamide matrix. Thisforms a very narrow band, which then enters the gel, and separation takes place. After this initial formation of the narrow band, during the rest of the process, the band broadens by diffusion. This is illustrated in the next slide. The alternative way to achieve the same high resistance to current flow in the region where the sample is firstloaded onto the gel, is by simply lowering the ion concentration in this region. Hence, the same ion can be inboth the separating gel and in the sample, but in the sample the buffer is diluted 10-fold.
Stacking - + NH2CH2CO2- (charged) NH3+CH2CO2- (neutral) current J(ion flux) must be constant throughout the gel pH-dependent mobility J1 glycine- Cl- J2 J1 = J2 C1V1 = C2V2 U = Mobility = ( ) J1 = C1U1E1 = C2U2E2 = J2 if (C1U1) << (C2U2) E1 >> E2 Protein in the glycine buffer experiences a high electric field because of the low electrophoretic mobility of glycine at the pH used -the protein moves to the ion boundary if Ugly < Uprot < UCl- C = concentration V = net velocity V E glycine Cl-
Stacking to t1 t2 _ + _ + _ + glycine- Cl- protein in sample buffer gel ion boundary gel start stack sieve Uglycine- < Uce (depends on pH) Alternative: Dilute running buffer (1/10) to make sample buffer (U1= U2) J1 = C1U1E1 = C2U1E2 = J2 (low) (high) in sample region
Two variants of gel electrophoresis 1. Gel mobility-shift assay for protein-DNA interactions 2. Pulsed field gel electrophoresis for separating very large DNA (chromosomes)
Electrophoresis of Protein-DNA complexes An interesting application of electrophoresis technology is the gel mobility shift assay for DNA-protein complexes. This is summarized in the next slide. The main idea is quite simple. A protein complex with DNA is formed in thesample. The mobility of this complex is different (less than) that of the DNA alone. As a result, the complex isvisualized as a separate band in the gel after it is run and then visualized for the presence of the DNA. Smallfragments of DNA are used in these assays.
DNA Gel Mobility - Shift Assay for quantitative and qualitative characterization of DNA-protein interactions + DNA protein DNA-protein complex (eg lac repressor) 1 Equilibrate Reaction Mixture 2 Load onto gel (e.g., 7.5% Polyacrylamide Tris-Borate- EDTA buffer) 3 Run gel 4 Stain with ethidium bromide for DNA (or detect using radioactive labels) sample gel + protein - protein DNA-Protein complex
Gel Mobility shift assay Why does this work? 1. Free DNA and Bound DNA species (along with free protein) are stacked and moved into the gel before there is any time for protein dissociation Takes ~ 1 min to complete this process 2 Once in the gel, the DNA-protein complexes are virtually locked together - low salt - excluded volume effect of gel (not fully understood) - “cage” effect of the gel + koff 1 koff > 1 min WHY?
The “cage effect” of the gel is such that when the protein and DNA dissociate they are trapped by the gel andcannot diffuse apart. Hence, the entropic advantage to dissociation is lost, so the effective dissociation constantshifts to greatly favor the complex staying together. The mobility shift assay can be used qualitatively to detect the presence of complexes, or it can be usedquantitatively to determine the affinity constant in solution between the protein and DNA. This is because the assay provides information about the amount of DNA that is free in solution and the amount which is bound tothe protein in the solution prior to getting trapped in the gel. As shown below, enough parameters can be measured to get a binding isotherm and a dissociation constant. Because of the ability to detect very lowconcentrations of DNA, very high affinity binding can be measured.
Gel Mobility Shift Assaycan provide all the information for a binding isotherm After running the gel: visualize the DNA: protein-DNA complex is retarded [DNA]total = [DNA]free + [DNA-protein] know this measure relative amounts from gel [protein]total = [protein]free + [DNA-protein] know this calculate this measure from gel can measure Kd ~10-8 to 10-12 M (see JBC (1991) 266 13661-) [DNA-Prot] [DNA] [DNA -prot] [protein]free