Download
1 / 47
470 likes | 560 Views
Management Practices across Europe, the US and Asia. Christos Genakos Cambridge & CEP. MOTIVATION. Large persistent productivity spread across firms and countries: UK productivity gap with the US going back 100 years China and India 10% to 20% of US GDP per capita

E N D
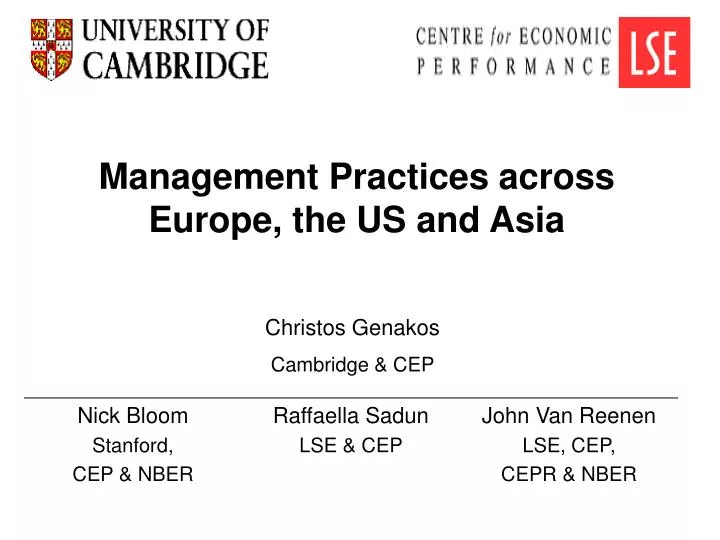
Management Practices across Europe, the US and Asia Christos Genakos Cambridge & CEP
MOTIVATION • Large persistent productivity spread across firms and countries: • UK productivity gap with the US going back 100 years • China and India 10% to 20% of US GDP per capita • Even after controlling for human and physical capital, there is a large “unexplained residual” in productivity both between countries and within countries • Could this be in part because of differences in management? • Historically there has been no international management data • Our aim: new project measuring and explaining management practices across firms and countries • Extends Bloom and Van Reenen (2007) methodology to 12 countries including India and China
OUTLINE • Why should management practices vary? • “Measuring” management practices • Evaluating the reliability of this measure • Describing management across firms & countries • Accounting for management across firms & countries
WHY SHOULD MANAGEMENT PRACTICES VARY? • Two models - not mutually exclusive • “Optimal choice of management practices” • Another factor of production (like advertising) • No “better” or “worse” style of management – depends on firm’s circumstances • “Managerial inefficiency” (Mundlak, 1961; Lucas 1978) • Part of total-factor productivity • Strictly “better” or “worse” styles of management • Empirically we find some support for both – today focus on “managerial inefficiency” evidence due to time constraints
OUTLINE • Why should management practices vary? • “Measuring” management practices • Evaluating the reliability of this measure • Describing management across firms & countries • Accounting for management across firms & countries
THE SURVEY METHODOLOGY • 1) Developing management questions • Scorecard for 18 monitoring, targets and incentives practices • ≈45 minute phone interview of manufacturing plant managers • 2) Obtaining unbiased comparable responses (“Double-blind”) • Interviewers do not know the company’s performance • Managers are not informed (in advance) they are scored • Run from LSE, with same training and country rotation • 3) Getting firms to participate in the interview • Introduced as “Lean-manufacturing” interview, no financials • Official Endorsement: Bundesbank, Treasury, CII & RBI, etc. • Run by 51 MBAs (loud, assertive & business experience)
MONITORING - i.e. “HOW IS PERFORMANCE TRACKED?” All 18 questions and 54 examples in Bloom and Van Reenen (2007)
ADDITIONAL CONTROLS FOR BIAS & NOISE • 8 INTERVIEWEE CONTROLS • Gender, seniority, tenure in post, tenure in firm, countries worked in, foreign, worked in US, plant location, reliability score • 3 INTERVIEWER CONTROLS • Set of analyst dummies, cumulative interviews run, prior firm contacts • 5 TIME CONTROLS • Day of the week, time of day (interviewer), time of the day (interviewee), duration of interview, days from project start
MANAGEMENT SURVEY SAMPLE • Interviewed over 4,000 firms across US, Asia & Europe • Obtained 63% coverage rate from sampling frame (with response rates uncorrelated with performance measures) • Medium sized manufacturing firms: • Medium sized (100 - 5,000 employees, median ≈ 275) because firm practices more homogeneous • Manufacturing as easier to measure productivity (currently piloting in healthcare and retail)
OUTLINE • Why should management practices vary? • “Measuring” management practices • Evaluating the reliability of this measure • Describing management across firms & countries • Accounting for management across firms & countries
INTERVAL VALIDATION OF THE SCORING Re-interviewed 222 firms with different interviewers & managers Firm average scores (over 18 question) Firm-level correlation of 0.627 (p-value =.000) 2nd interview 1st interview
EXTERNAL VALIDATION OF THE SCORING Performance measure country c management (average z-scores) ln(capital) other controls ln(labor) ln(materials) • Use most recent cross-section of data (2006) • Not causal estimation, only shows management data informative
EXTERNAL VALIDATION: PRODUCTIVITY & PROFIT Cross sectional regressions. All columns include country controls. Robust s.e. in ( ) below. For probit p-values in [ ] below
LINKED TO PERFORMANCE IN ALL THE COUNTRIES (NOT JUST ANGLO-SAXON ONES) US & UK Japan & China Labor Productivity Labor Productivity Management Management Greece, Portugal & Italy France, Germany, Sweden & Poland Labor Productivity Labor Productivity Management Management
OUTLINE • Why should management practices vary? • “Measuring” management practices • Evaluating the reliability of this measure • Describing management across firms & countries • Accounting for management across firms & countries
Average management score, by country U.S. Germany Sweden Japan Italy UK France Poland Portugal Greece China India COUNTRY LEVEL MANAGEMENT SCORES 3 statistically distinct groups appear • U.S., Germany, Sweden and Japan • Italy, U.K., France, and Poland • Portugal, Greece, China and India
People management Operations management BUT THE US IS NOT BEST AT EVERYTHING - THERE ARE NATIONAL STRENGTHS & WEAKNESSES The US is world leading in people management, but Germany, Sweden and Japan are better on average at operations management
U.S. Japan Germany Italy Greece China Portugal ALSO THE AVERAGE HIDES MUCH VARIATION Distribution of firm level management scores, by country Sweden • 85% of variation in management scores within countries • Long ‘tail’ of poorly managed firms pulls down the average management score of low performing countries Poland U.K. France India
OUTLINE • Why should management practices vary? • “Measuring” management practices • Evaluating the reliability of this measure • Describing management across firms & countries • Accounting for management across firms & countries
THE AVERAGE MANAGER ALSO THINKS HIS FIRMS MANAGEMENT IS WELL ABOVE AVERAGE Response to the Question “Excluding yourself, how would you rate your company’s management from 1 to 10, one being the worst and ten being the best?” “Worst Practice” “Average” “Best Practice” Share of firms Management self-score
AND THIS OVER-SCORING OCCURS IN EVERY COUNTRY IN OUR SAMPLE Actual score Self score* * Divided by 2 to normalize to a similar scale
COMPETITION & MODELS OF MANAGEMENT • “Exogenous managerial inefficiency” – positive impact • Selection models Hopenhayn (1992) or Syverson (2004) • “Optimal choice model” – ambiguous impact • In contracting models balance between opposing profit and market-size effects (Raith 2003, Vives 2004)
COMPETITION AND MANAGEMENT PRACTICES 3 competition proxies from Nickell (1996) & Aghion et al. (2005) 1 Lerner index = (operating profit – capital costs)/sales ≈ rents2 Includes 108 SIC-3 industry, country, firm-size, public and interview noise (analyst, time, date, and manager characteristic) controls3 s.e. in ( ) below, robust to heteroskedasticity, clustered by country-industry
FAMILY FIRMS & MANAGEMENT – AN OLD TOPIC • Alfred Chandler1 and David Landes2 claimed that the UK industrial decline relative to US & Germany was linked to family firms • “The Britain of the late 19th Century basked complacently in the sunset of economic hegemony. Now it was the turn of the 3rd generation…and the weakness of British enterprise reflected their combination of amateurism and complacency” 1 Alfred Chandler, “Scale and Scope: The Dynamics of Industrial Capitalism”, (1994)2 David Landes, “The Unbound Prometheus: Technological Change and Industrial Development in Western Europe from 1750 to the Present”, (1969)
FAMILY FIRMS AND MODELS OF MANAGEMENT PRACTICES • Likely family impact depends on involvement • Ownership but not management probably positive • Concentrated ownership so better monitoring • Management probably negative • Smaller pool to select CEO from • Possible “Carnegie” effect on future CEO’s • Less career-concern incentive for non-family managers • All effects likely to be worse with primo geniture (succession of eldest son to CEO position)
FAMILY MANAGEMENT (PARTICULARLY A PRIMO GENITURE SELECTED CEO) IS PROBLEMATIC 1 Family defined as 2nd generation or later2 Based on question: “How was management of the firm passed down: was it to the eldest son or by some other way?”. Non primo geniture alternatives: other sons, son in-laws, daughters, brothers, wives, nephews and cousins. Note includes SIC-3 digit, country, skills, firm size and public controls
WE ALSO LOOK AT MULTINATIONALS AS A WAY TO EVALUATE THE ROLE OF LOCAL CONDITIONS • Interesting to examine because: • If the management variations all due to local constraints then multinationals should look like domestic firms • If instead management partly a technology then multinationals may export this • Idea in theory papers like Helpman et al. (2004), Antras et al. (2008), Burstein & Monge (2008)
THERE IS NO TAIL OF REALLY BADLY RUN MULTINATIONALS .8 .6 Domestic Firms Density .4 .2 0 1 2 3 4 5 Our management score - average across 18 questions .8 .6 Foreign Multinationals Density .4 .2 0 1 2 3 4 5 Our management score - average across 18 questions
US Japan Germany Sweden UK Italy France Poland Portugal China India Greece 2.4 2.6 2.8 3 3.2 3.4 mean of domestic firms mean of multinationals MULTINATIONALS DO APPEAR TO BE WELL MANAGED IN ALL COUNTRIES
MANAGEMENT PRACTICES ALSO MAY REFLECT LABOR MARKET REGULATIONS • Tough hiring/firing practices may be impaired by law • Management practices for hiring, firing, pay and promotions is negatively correlated with strength of labor market regulations
LABOUR MARKET REGULATION IS NEGATIVELY CORRELATED WITH PEOPLE MANAGEMENT… Correlation of -0.752 Average people management scores World Bank labor market regulation index
QUANTIFYING EFFECTS OF COMPETITION, FAMILY FIRMS, MULTINATIONAL & LABOR REGS: • ACROSS COUNTRIES ~ ½ VARIATION • ACROSS FIRMS ~ ½ VARIATION
COMPETITION, FAMILY FIRMS, MULTINATIONALS & LABOR REGULATIONS ACCOUNT FOR ≈ ½ COUNTRY SPREAD US Germany Sweden Japan UK France Italy Poland Portugal Greece China India 2.4 2.6 2.8 3 3.2 3.4 management predicted from comp, family, MNE and regulation raw management data Marginal R-squared on country fixed-effects reduced by 45% after controlling for number of competitors, family management and primo geniture, multinational status and labor market regulations
“GOOD DOMESTIC” (MANY COMPETITORS, NOT PG FAMILY) OR MULTINATIONAL N=2899 5.9% firms in tail1 “BAD DOMESTIC” (FEW COMPETITORS OR PG FAMILY) N=1244 18.1% firms in tail1 1 Tail defined as a score ≤ 2. In the whole sample 9.6% of firms are in the tail.
SUMMARY • Original methodology for measuring management practices for over 4000 firms across 12 countries • Better management practices are strongly associated with superior firm performance • Significant within country variation in management practices • Product market competition, family management, multinational status and labor regulation account for • About 50% of tail of badly managed firms • About 50% cross country management gap • It was hard work but…?
MY FAVOURITE QUOTES: Getting those managers on the phone was not easy… [Female Interviewer speaking to a US manager] Interviewer: “I was wondering if you would have 30-40 minutes to talk with me about your day-to-day production process?” US manager: “You would have a better chance of coming in here with a razor and slitting my wrists than getting me on the phone for 40 minutes!!!” French secretary: “You want to talk to the plant manager? They are legal proceedings against him, so hurry up!! ”
MY FAVOURITE QUOTES: The Swedish manufacturing goals Production Manager: “Workers individual goals? They just want to go home!” Americans on geography Interviewer: “How many production sites do you have abroad? Manager in Indiana, US: “Well…we have one in Texas…” The difficulties of defining ownership in Europe Production Manager: “We’re owned by the Mafia” Interviewer: “I think that’s the “Other” category……..although I guess I could put you down as an “Italian multinational” ?”
BEST QUOTE: Swedish female plant manager for medical instruments company with 70% world market share asked about the competition they face in the product marketplace: “We have no competitors, just parasites”
Management Practices across Europe, the US and Asia Christos Genakos Cambridge & CEP
FAMILY OWNERSHIP VARIES ACROSS COUNTRIES • About 1/4 of Japanese, US and Northern European firms family owned • About 3/4 of Indian firms family owned Poland Sweden China Japan France US UK Germany Italy Portugal Greece India 0 .2 .4 .6 .8 share family owned (2nd+ generation) share founder owned (1st generation)
MULTINATIONALS ARE MOST COMMON IN NORTHERN EUROPE, LESS IN ASIA & THE US France Sweden UK Poland Germany Greece Italy Portugal China US India Japan 0 .1 .2 .3 .4 .5 Foreign multinational % of firms interviewed
FIG 3. COUNTRY LEVEL RELATIVE SCORES Sweden France Relatively better at ‘operations’ management Italy Germany Japan Portugal Greece UK Relatively better at ‘people’ management China US Poland India -.4 -.2 0 .2 .4 mean of people (human capital) – operations (physical capital) management
FIG 4. MULTINATIONALS TAKE THESE HOME COUNTRY PRACTICES ABROAD Sweden Belgium Japan Switzerland Denmark Finland France Italy Germany Holland Canada UK US -.4 -.3 -.2 -.1 0 .1 mean of people (human capital) – operations (physical capital) management Only source countries with 25+ subsidiaries in our data
CONCERNS WITH OUR MANAGEMENT MEASURE? • (2) Firm performance-related measurement bias in management score (i.e. the “happy manager” problem), but • Surveying methodology using examples tries to minimize this • Competition and management positively linked (later) • Management-performance link is as important in Europe (where managers less likely to “talk up” Anglo-Saxon practices) as it is in UK & US • No link between past productivity growth & management • Not all questions significant (and not linked to “subjectivity”) • Other subjective questions insignificant – i.e. “feel-good” work-life balance questions, organisational devolvement questions • So potential problem – but no evidence that major phenomenon
…BUT, LABOUR MARKET REGULATION IS NOT LINKED WITH POOR OPERATIONS MANAGEMENT Correlation of -0.140 Average operations management score World Bank labor market regulation index