Download
1 / 42
480 likes | 715 Views
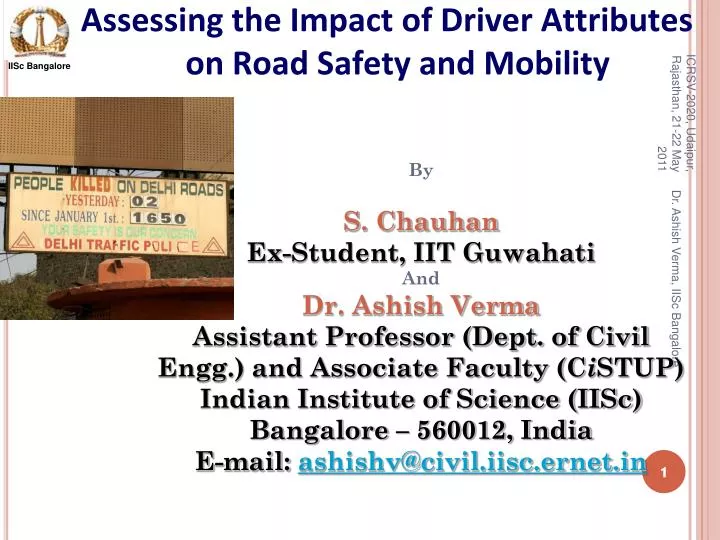
By S. Chauhan Ex-Student, IIT Guwahati And Dr. Ashish Verma Assistant Professor (Dept. of Civil Engg.) and Associate Faculty (C i STUP) Indian Institute of Science (IISc) Bangalore – 560012, India E-mail: ashishv@civil.iisc.ernet.in.

E N D
By S. Chauhan Ex-Student, IIT Guwahati And Dr. Ashish VermaAssistant Professor (Dept. of Civil Engg.) and Associate Faculty (CiSTUP)Indian Institute of Science (IISc) Bangalore – 560012, IndiaE-mail: ashishv@civil.iisc.ernet.in Dr. Ashish Verma, IISc Bangalore Assessing the Impact of Driver Attributes on Road Safety and Mobility 1
Crash Involvement FactorsRarely a single cause, but it is usually a causal chain of events. Dr. Ashish Verma, IISc Bangalore
Vision • Drivers, Cyclists, Pedestrians are able to use road safely because of the help received by the eyes in seeing the road and traffic conditions. Dr. Ashish Verma, IISc Bangalore
VISUAL FACTORS IN PERCEPTION AND IDENTIFICATION • Visual Acuity • Peripheral Vision • Depth Perception • Glare Recovery • Colour Vision Dr. Ashish Verma, IISc Bangalore
Visual acuity 3o – 5o Fairly clear vision 10o - 12o Peripheral vision 120o – 180o Dr. Ashish Verma, IISc Bangalore
Color Vision • Identify Traffic Lights • Color Schemes in Traffic Signs Dr. Ashish Verma, IISc Bangalore
Glare from Head Lights • Different Drivers have different capacity to adapt to glare • Age of Driver is an important factor Dr. Ashish Verma, IISc Bangalore
Depth Perception • Drivers need proper depth perception for judging distances and speed • Especially important in overtaking maneuvers. • Speed impairs depth perception Dr. Ashish Verma, IISc Bangalore
Lag Distance Braking Distance Distance Travelled during Reaction Time Distance Travelled after application of brakes SAFE STOPPING SIGHT DISTANCE Dr. Ashish Verma, IISc Bangalore
Safe overtaking sight distance d1 d2 d3 d4 Dr. Ashish Verma, IISc Bangalore
Task of Driving • Driving is a skill that requires constant and complex co-ordination of mind and body of the driver. • It involves multi-task activities (navigation, guidance, vehicle control) i.e. operating heavy machinery at high speed, navigating across changing terrain, calculating speeds and distances and responding to all the other drivers and obstacles. • A driver’s ability to manage driving related psychomotor functions varies widely and can change from day-to-day depending upon his level of stress and fatigue. Dr. Ashish Verma, IISc Bangalore
Skills Needed by a Driver Dr. Ashish Verma, IISc Bangalore Visual Skill: (seeing) e.g. watching the road in front and around the vehicle, using mirrors, shoulder checks, checking gauges, speedometer etc. Auditory Skill (listening) e.g. squealing of brakes, the sirens of an emergency vehicle, vehicle sounds etc. Bio-mechanical (performing-hand-eye co-ordination), e.g. turning the steering wheel, activating signals, headlights, horn etc., pressing the accelerator, brakes, clutch etc. Cognitive (Thinking) e.g. anticipating any future movements, assessing situations such as movements of other vehicles, weather conditions, preparing to avoid hazards etc. 13
Driver Licensing – Current Provisions in India Dr. Ashish Verma, IISc Bangalore Motor Vehicle Act 1988 and Central Motor Vehicles Rules 1989 As per Sub-section (3) of Section-8 of Motor Vehicle Act 1988, a self-declaration, medical certificate from a registered medical practitioner in case of a non-transport and transport vehicle respectively, is sufficient for grant of learner’s license. The motivation for the present study comes from these deficiencies in the existing clauses. 14
Attempt is to Address the following questions:- Dr. Ashish Verma, IISc Bangalore Is the current provision for driver’s physical testing, as part of driver licensing, adequate? Does it ensures creation of licensed drivers that are physically fit to be safe drivers? What is the impact of the presence of physically unfit drivers (with respect one or the other parameters) in traffic on road safety and mobility? 15
Study focuses on the following visual skills of the drivers:- Dr. Ashish Verma, IISc Bangalore Visual Acuity Peripheral Vision Depth Perception Glare Recovery Colour Vision Contrast Sensitivity Phoria etc. 16
Objective Dr. Ashish Verma, IISc Bangalore Identify the shortcomings in the physical attributes of the drivers. Quantify the effects of abnormalities in these attributes on road safety and mobility using micro-simulation tool. 17
Methodology (Flow of Work) Dr. Ashish Verma, IISc Bangalore 18
Driver Vision Screen Tester (DVS-GT Vision Screener) Dr. Ashish Verma, IISc Bangalore It can test; acuity vision, peripheral vision, colour vision, depth perception, contrast sensitivity, glare recovery, phoria.
Data Collection Dr. Ashish Verma, IISc Bangalore The tests carried out using Driver Vision Screen (DVS) tester tested the drivers for • Acuity (both eye) • Night vision, • Depth perception, • Glare recovery, • Contrast sensitivity, • Phoria, • Colour blindness, • Peripheral vision etc. 20
Field Data Collection and Database Dr. Ashish Verma, IISc Bangalore The data was collected in 2009, during the Road Safety Week organized by Lion’s Club Guwahati and Guwahati Traffic Police at Maligaon in Guwahati city. Further data collection was also carried inside the IIT Guwahati campus. A total number of 189 drivers were interviewed including Bus drivers/ Truck Drivers, Car drivers, Auto/Jeep driver and Scooter/ Motor-Cycle drivers. 21
Glimpses of Data Collection Dr. Ashish Verma, IISc Bangalore
DRIVER’S VISION: PERCENTAGE ABNORMALITIES • 3% of the drivers failed in the phoria test, which checks for proper eye muscles and co-ordination of both eyes to correctly identify the placement of an object ahead. • 12% of the drivers performed unacceptable in the depth judgment test • 7% of the drivers failed in the glare recovery test • 5% of the drivers were found to have problem of tunnel vision while driving. • 15% of the drivers were found to have unacceptable acuity vision in one of the eyes and 4% in both the eyes • 5% of the drivers have problem with night vision (vision in the presence of head light) • Performance of 5% of the drivers was found unacceptable in colour vision test. Dr. Ashish Verma, IISc Bangalore 23
Driver’s vision: Variation with respect to Age Dr. Ashish Verma, IISc Bangalore 24
Driver’s vision: Variation with respect to Age • The middle age group (26-39 years) ~ maximum percentage of drivers with 31(40.78%) abnormal depth perception. • The middle age group ~ highest percentage of drivers failing in colour vision test. • The percentage of cases failing in the glare recovery test increases with age. • The higher age group (>=40) ~ highest percentage (20%) of drivers that fail in the glare recovery test. • The percentage of cases failing in the acuity test is similar in all the age groups. Dr. Ashish Verma, IISc Bangalore 25
DRIVER’S VISION: VARIATION WITH RESPECT TO DRIVING EXPERIENCE Dr. Ashish Verma, IISc Bangalore 26
Driver’s vision: Variation with respect to Experience Dr. Ashish Verma, IISc Bangalore The most experienced group (>9 years) has the maximum percentage of drivers (42.19%) which fail to clear the depth perception test. The middle experienced group has the highest percentage of drivers failing in colour vision test. The most experienced group also has the highest percentage (17.19%) of drivers that fail in the glare recovery test. 27
Driver’s vision: Variation with respect to Vehicle Type Dr. Ashish Verma, IISc Bangalore 28
Driver’s vision: Variation with respect to Vehicle Type Dr. Ashish Verma, IISc Bangalore A huge percentage (85.7%) of Auto/ passenger jeep drivers fail in depth perception test. This can also be because of the insufficient number of drivers tested for the particular vehicle group. This figure is also high (50%) for the Bus drivers. Bus drivers also have the highest percentage which fails to clear the colour vision test. Also a similar trend is shown in the acuity and glare recovery test with mainly public transport vehicle drivers failing to clear the test. 29
The results of the these three characteristics, tested using DVS-GT Vision Screener were used as an input in simulation software VISSIM.Data of Traffic composition, Vehicle inputs, geometrical dimensions etc. was obtained from Guwahati Metropolitan Development Authority (GMDA). Dr. Ashish Verma, IISc Bangalore 30
Simulation (VISSIM) Dr. Ashish Verma, IISc Bangalore A section of a typical Guwahati urban road was considered, and the dimensions of the section are that of NH 37 mid-block section from Khanapara to Beltola junction. 31
Simulation (VISSIM) Dr. Ashish Verma, IISc Bangalore Through simulation, identify the cases in which the time headway is within ‘p’ seconds of each other. This case is defined as the possibility of a conflict, which is used as a parameter to study the impact on safety. The value of p is taken as 2 seconds in this project is based on the values recommended by various traffic authorities including Delhi Police (http://www.delhitrafficpolice.nic.in/driving-tips) and Department for Transport, Energy and Infrastructure, South Australia, Australia (http://www.transport.sa.gov.au/licences_certification/hazard_perception/tsa-safe-distance-1sec-2sec.asp ). Similarly, average delay is chosen as the parameter to quantify the impact of driver abnormalities on mobility. 32
Simulation (VISSIM) Dr. Ashish Verma, IISc Bangalore The quantification includes comparative analysis between the following conditions:- Traffic in ideal situation with all drivers being normal i.e. drivers who performed ‘acceptable’ with respect to all test parameters. Traffic in real Indian situation with certain percentage of drivers (obtained from field tests) having certain specific type of abnormality i.e. performed ‘unacceptable’ with respect to glare recovery/night vision and depth judgment. 33
Simulation Runs Dr. Ashish Verma, IISc Bangalore 34
Effect of abnormal Night Vision/ Glare Vision on mobility Percentage of drivers failing in Night conditions= 16.4% Dr. Ashish Verma, IISc Bangalore 35 Delay in seconds
Effect of abnormal Night Vision/ Glare Vision on probability of crashes Percentage of drivers failing in Night conditions= 16.4% Dr. Ashish Verma, IISc Bangalore 36 Percentage of conflicts in different cases
Effect of abnormal Depth perception on mobility Dr. Ashish Verma, IISc Bangalore 37
Effect of abnormal Depth perception on probability of crashes Dr. Ashish Verma, IISc Bangalore 38
PRILIMENARY RECOMMENDATION REGARDING INDIAN CONDITIONS Dr. Ashish Verma, IISc Bangalore Renewing License- • Presently a large gap in renew age • Middle age group drivers fail the most in DVS tests • Decrease renew period Test according to Specifics of a driver- • In India are common for all the drivers. • Different tests based on the type of vehicle , age etc. Testing physical abilities of the drivers – • Present test based on driving skills • DVS like testing procedure should be used for testing with prevailing Indian conditions • Acceptable and unacceptable limits of the same should be decided for the Indian conditions. 39
Recommendation regarding Indian Conditions Dr. Ashish Verma, IISc Bangalore Licensing Age • Two wheelers involved in major crashes • Young drivers are more involved in crashes. • Learners' license age should be decreased to give sufficient time for learning Pre-Licensing Training Psychological assessment 40
Transportation Research Group of India (TRG) (http://www.trgindia.org) Mission - To aid India’s overall growth through focused transportation research, education, and policies in the country. 1st Conference of TRG – 7th to 10th Dec. 2011, Bangalore, India Dr. Ashish Verma, IISc Bangalore