Download
1 / 13
130 likes | 143 Views
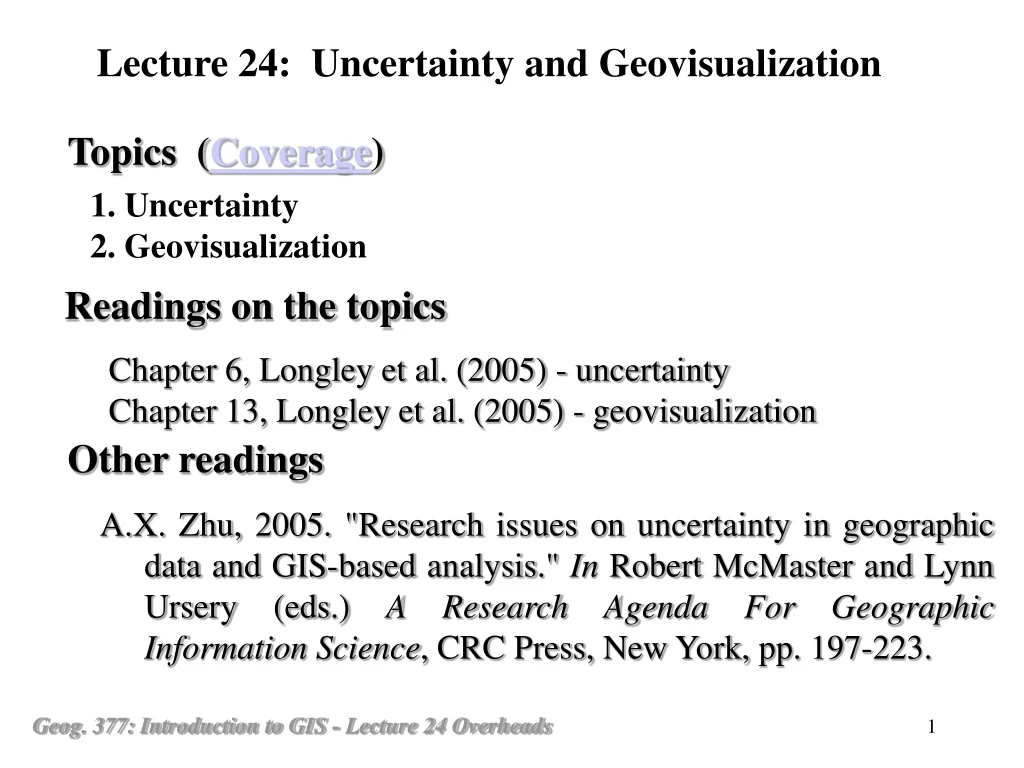
Lecture 24: Uncertainty and Geovisualization. Topics ( Coverage ). 1. Uncertainty 2. Geovisualization. Readings on the topics. Chapter 6, Longley et al. (2005) - uncertainty Chapter 13, Longley et al. (2005) - geovisualization. Other readings.

E N D
Lecture 24: Uncertainty and Geovisualization Topics (Coverage) 1. Uncertainty 2. Geovisualization Readings on the topics Chapter 6, Longley et al. (2005) - uncertainty Chapter 13, Longley et al. (2005) - geovisualization Other readings A.X. Zhu, 2005. "Research issues on uncertainty in geographic data and GIS-based analysis." In Robert McMaster and Lynn Ursery (eds.) A Research Agenda For Geographic Information Science, CRC Press, New York, pp. 197-223.
Outlines 1. Uncertainty: 1.1 Error and Uncertainty: Error: Difference between the value we have and that of the true value Uncertainty: a relative measure of the above difference Its consequence: 1.2 Life cycle of Geographic Data: (Lifecycle and Data flow) 1.3 Types of Errors in GIS 1) Based on what is wrong (1) Position errors: (2) Attribute errors: (3) Topological errors:
1.3 Types of Errors in GIS (continued …) 2) Source of errors (a) Measurement errors (b) Perception errors (data model errors) (c) Data conversion and transformation errors (d) Errors from multiple data integration 1.4. Management of Uncertainty: 1.4.1 Assumption 1: 1) What it is: Data is error free in terms of absence of factually wrong data: a) no measurement errors (such as field equipment): b) no sampling errors (sampling is adequate for data layers): c) data is updated sufficiently:
1.4.1 Assumption 1: (continued …) 2) Factors violating Assumption 1: a) instrument problems b) age of data: c) areal coverage: d) relevance: e) sampling (manual and automated): (i) density of observations (ii) positional accuracy (iii) content accuracy (laboratory test): f) data input: 3) Possible solutions Care and money
1.4.2 Assumption 2: 1) What it is: Data is error free in terms of natural variation and conceptual models: (geographic features or phenomena can be fully represented by the map model.) 2) Factors violating Assumption 2: a) natural geographic phenomena in many cases vary gradually over space. b) the map model (boundary model) cannot represent this gradual variation. (i) map scale (ii) classifications and generalizations: 3) Possible Solutions new model: fuzzy model
1.4.3 Assumption 3: 1) What it is: Systems are errors free in terms of its representation of geographic data: 2) Factors violating Assumption 3: a) numbers cannot be represented in computer as they are in the real world (Table 6.2: Rounding Errors) b) the relationships among geographic phenomena are difficult to be represented adequately in the computer. 3) Possible Solutions: a) double-precision b) convert to lower level measuring units (inches, centimetres or millimetres)
1.4.4 Assumption 4: 1) What it is: Data analysis are error free in terms of error generation and propagation: a) Data analysis does not create new errors. b) Data analysis does not inflate errors from different layers. 2) Factors violating Assumption 4: a) data conversion analogue to digital: digitizing data model conversion: raster vs. vector b) computer implementations of simple arithmetic violate important real number axioms of distributivity, associativity, and commutativity. (A/B)*C not as the same as A*(C/B) in computer c) polygon overlay processes:
1.4.4 Assumption 4: (continued …) 3) Solutions: (a) avoid data conversion as much as possible (b) avoid intercorrelated variables: (c) add where possible (d) if you cannot add, multiply or divide (e) avoid as far as possible taking differences or raising variables to powers. 1.5 Overall management strategy 1) Education 2) Reduce as much error as possible 3) Describe the amount of errors in terms of uncertainty 4) Model the propagation of errors through spatial analyses using GIS 5) Assess the impact of uncertainty in the results on decision making
2. Geovisualization 2.1 Geographic Representation vs. Geographic Presentation 2.1.1 Geographic representation A process of depicting as much information as possible about a given geographic feature/phenomenon for the purpose of information storage. Try to capture the detailed information about the object -- how much detail can be obtained -- how to maximize the information content The focus is at the details and the richness of information about a given geographic feature/phenomenon. It is limited only by the ability of collecting data and the conceptual model used to retain the collected data. Resolution is often associated with geographic representation
2.1 Geographic Representation vs. Geographic Presentation (Continued …) 2.1.2 Geographic presentation A process of showing selected aspects of selected geographic feature/phenomenon for the purpose of visualization The focus is on the selected piece of information that is considered to be important/interesting to the audience It is limited by the tools for visualization and by the sensitivity of human perceptive organs. Data are often generalized and scale is often associated with presentation 2.1.3 Maps vs. GIS data layers: A map is the representation and presentation of geographic information as the combined one, limited by visualization GIS data layers are forms of representation, limited by source data, some digital maps are not in this way. 2.1.4 Implication for GIS analysis:
2.2 Forms of GIS Output 2.2.1 Hardcopy (Reports and Maps) (cartographic presentation) a. Elements of a map (Geog. 370) b. Audience and information content 1) Knowing your audience 2) Knowing what information to present (a) How many maps do you need? (b) How much detail do you need? (c) How many themes (different types of features) do you need? (d) How many features do you need? c. Organising and displaying information 1) Choosing a proper map type 2) Determining map scale 3) Classifying information 4) Using proper symbols and text 5) Using charts, tables, and other graphics
2.2 Forms of GIS Output (continued …) 2.2.2 Softcopy 2.2.2.1 Web-based map publishing and animated maps (at cartographic presentation level) (Web-based mapping) (Alcohol-Related Incidents) (Standing View of Landscape) (Airplanes over North American Sky) Geog. 370 -> Geog. 575 (Prof. Mark Harrower) 2.2.2.2 Digital data layers (at representation level) http://ortho.mit.edu http://www.usgs.org
Questions: 1. What is the difference between error and uncertainty? 2. What are the sources of errors in GIS data? 3. What are the four assumptions about data in GIS and how are they violated and what are the possible solutions? 4. What are the differences between geographic presentation and geographic representation? 5. Is a map representation or presentation? Are all GIS data layers of geographic representation? Why? 6. What is the danger in treating a geographic presentation as geographic representation?