Download
1 / 36
360 likes | 364 Views
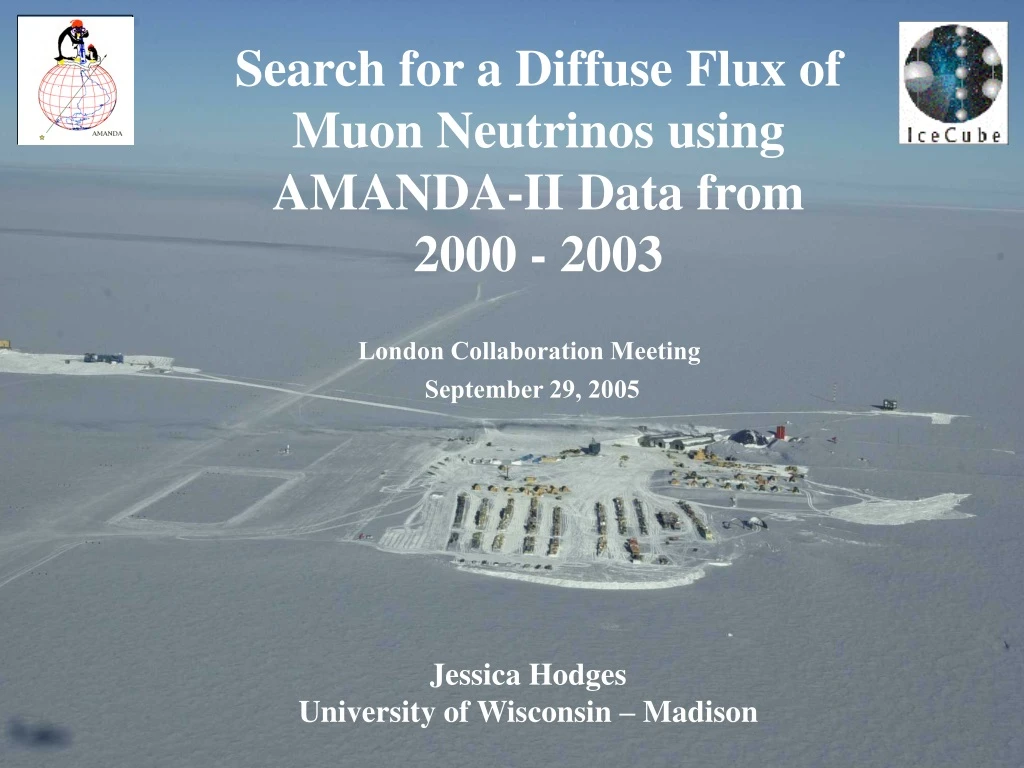
Search for a Diffuse Flux of Muon Neutrinos using AMANDA-II Data from 2000 - 2003. London Collaboration Meeting September 29, 2005. Jessica Hodges University of Wisconsin – Madison. downgoing muons and neutrinos. m. n. E -2. E -3.7. m. m. “Signal”.

E N D
Search for a Diffuse Flux of Muon Neutrinos using AMANDA-II Data from 2000 - 2003 London Collaboration Meeting September 29, 2005 Jessica Hodges University of Wisconsin – Madison
downgoing muons and neutrinos m n E-2 E-3.7 m m “Signal” Search for a Diffuse Flux of Neutrinos (TeV – PeV) 2000 – 2003 : 807 days of detector livetime Monte Carlo simulation Atmospheric Muons: muons created when cosmic rays hit the atmosphere, including simulation of simultaneous downgoing muons Atmospheric Neutrinos: neutrinos created when cosmic rays hit the atmosphere. Have an E-3.7 energy spectrum. Signal Neutrinos: extraterrestrial neutrinos with an E-2 energy spectrum <1> Remove downgoing events with a zenith angle cut and by requiring high quality event observables. <2> Separate atmospheric neutrinos from signal by an energy cut.
After Event Quality Cuts The likelihood ratio cut is zenith dependent. This allows events near the horizon to survive the quality cuts. The zenith angle distribution of high quality events before an energy cut is applied. The signal test flux is E2 = 10-6 GeV cm-2 s-1 sr-1.
FINAL CUTS Track Length > 170 meters Ldirb[Pandel 32] > 170 Number of Direct Hits >13 Ndirc[Pandel 32] > 13 Smoothness < 0.250 abs(Smootallphit[Pandel 32]) < 0.250 Median resolution < 4.0 median_resolution(P08err1,P08err2)<4.0 Likelihood ratio vs zenithJkchi[Bayesian 64] – Jkchi[Pandel 32] > -38.2*cos(Zenith[Pandel 32]/57.29)+27.506 Zenith > 100 Zenith[Pandel 32] >100 Number of channels >= 100 Nch >= 100 Additional cuts on the experimental data: 2000: 47 <= Gpsday <= 309 2001: 44 <= Gpsday <= 293 2002: 43 <= Gpsday <= 323 2003: 43 <= Gpsday <= 315 *See my webpage for details of this function designed by T. Becka
Unblinding! Optimized Final Energy Cut: NChannel >= 100 Number of Atmospheric Neutrinos Predicted = 9.8 Signal (E2 flux = 10-6 ) Predicted = 60.8 Number of Data Events Observed = 6
Next steps: • Show that we understand the detector response for high energy (>100 channel) muon events. • 2) Determine the systematic errors. • 3) Set final sensitivity and limit (with and without errors) for different signal models.
Do we understand high energy (Nch > 100) events? To study the response of the detector to high energy muon events, I applied an inverted analysis to the minimum bias data and atmospheric muon Monte Carlo (dCorsika). * Cuts on track length, number of direct hits, smoothness and median resolution remained the same. * The likelihood ratio vs. zenith cut was inverted to select events with the highest probability of being downgoing after a new set of inverted fits was performed.
Zenith distributions show agreement for events with high and low numbers of channels hit. NChannel < 100 Data Atms μ MC NChannel > 100 Cos(Zenith) Data Atms μ MC
After applying an inverted analysis on the minimum bias files, the channel distribution shows agreement in shape.
However, as reported in other analyses, the agreement between data and Monte Carlo for direct hit parameters is not so great. Data Atms μ MC NChannel < 100 Data Atms μ MC Number of Direct Hits (ndirc) NChannel > 100 Number of Direct Hits (ndirc)
Good agreement between the data and atmospheric muons at high quality levels we understand how the detector responds to high energy muon events from any direction
Study systematic errors by considering other atmospheric neutrino flux models… Thus far, all simulation done with Lipari model. Use the NeutrinoFlux class written recently in Madison to test three other atmospheric neutrino models. 1 – Bartol (2004) 2 – Honda (2004) 3 - Fluka (2005) The nusim normalization and number of events predicted in the final set (after the energy cut) will vary by model.
Comparing the flux models… The data is generally below Lipari and Bartol and above Honda and Fluka.
Systematic errors and the normalization factor… ~11 atmospheric ν events survived to the final data set. Normalization Used = 0.88 atmospheric ν prediction was 9.7 Lipari Corrected normalization = 0.888 (not 0.88) Corrected atmospheric νprediction = 9.8 events (not 9.7) My final cut level What if I had used a different neutrino model?
The atmospheric neutrino model affects the nusim normalization. Average Normalization over 4 Models = 1.00 Error in Normalization Factor = 0.14/1.00 = 14%
Atmospheric Neutrinos vs E-2 Signal Atmospheric νprediction = Average from 4 Models = 7.6 Background range = 7.6 +- 2.5 = 7.6 +- 33%
Nch>=100 100 680 NChannel Systematic Error on Background Below 100 channels, all four models were normalized to the data. Finding the number of events predicted past 100 channels tests the shape of the different models. average number of atmospheric neutrinos (Nch>=100) for the four models = 7.6 events greatest that any model deviates from the average = 2.5 events
Systematic Error on Signal Efficiency This error takes into account uncertainty in the absolute normalization of the atmospheric neutrino flux. Use the normalization as the efficiency value. Nch>=100 100 NChannel 680 This is equivalent to the error in the number of signal (E-2) events predicted after the final energy cut. average normalization factor for the four models = 1.00 greatest that any model deviates from the average = 0.14 However, simply claiming an efficiency error based on the four models is not enough. There is still an overall uncertainty in the neutrino flux of 10 -15%.
How the Systematic Error Code Works The code recalculates the pdf for each value of the unknown μ and constructs a “smeared”, wider confidence belt based on the 12 equally likely inputs. Background Efficiency Probability of this Scenario 5.1 0.918 1/12 5.1 1.08 1/12 5.1 1.24 1/12 7.3 0.969 1/12 7.3 1.14 1/12 7.3 1.31 1/12 8.1 0.759 1/12 8.1 0.893 1/12 8.1 1.03 1/12 9.8 0.755 1/12 9.8 0.888 1/12 9.8 1.02 1/12 - 15 % Fluka +15 % Honda Bartol Lipari
Systematic errors widen the confidence belt. No Errors Applied μ = true but unknown signal X = number of events measured 0 0
Systematic errors widen the confidence belt. Correlated Systematic Errors Applied μ = true but unknown signal X = number of events measured 4m
Event Upper Limit with Systematic Errors = 4.52 • νμ(E) < ( μ / nsignal) test E-2 • νμ(E) < (4.52 / 68.45) 10-6 E-2 GeV cm-2s-1sr-1 • νμ(E) < 6.6 *10-8 E-2 GeV cm-2s-1sr-1 Limit on Diffuse Flux of νμwith systematic errors
Atmospheric Neutrinos vs Charm D Signal Atmospheric νprediction = Average from 4 Models = 34.3 Background range = 34.3 +- 15.3 = 34.3 +- 45% * These numbers are coming soon!
Atmospheric Neutrinos vs SDSS Prompt Signal Atmospheric νprediction = Average from 4 Models = 1.7 Background range = 1.7 +- 1.4 = 1.7 +- 82% * These numbers are coming soon!
More Prompt νModels Background = Conventional Neutrinos (Bartol) Signal = Prompt Neutrinos Preliminary to be continued with more models and with all four conventional atmospheric fluxes …..
Summary * After unblinding the data (Nch>=100), 6 events were seen. * We understand how the detector responds to high energy (Nch >= 100) events because we see good agreement between the high quality muon tracks in the downgoing muon data and dCorsika minimum bias files. * Four conventional atmospheric neutrino models were compared. Systematic errors were settled from this study. * Limit on a diffuse flux of E-2νμwith systematic errors: *Other prompt neutrino models are under investigation. I will send out an unblinding proposal. νμ(E) < E-2 6.6 *10-8 GeV cm-2s-1sr-1
True Energy of the Monte Carlo before and after the Energy Cut
After applying an inverted analysis on the minimum bias files, the likelihood ratio (down to up) distribution shows agreement in shape. Data Atms μ MC NChannel < 100 Data Atms μ MC Likelihood Ratio (down to up) NChannel > 100 Likelihood Ratio (down to up)
As reported in other analyses, there is poor agreement between data and Monte Carlo for direct hit parameters. Data Atms μ MC Data NChannel < 100 Atms μ MC Track Length (ldirb) NChannel > 100 Track Length (ldirb)