Download
1 / 76
760 likes | 772 Views
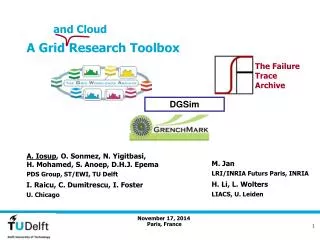
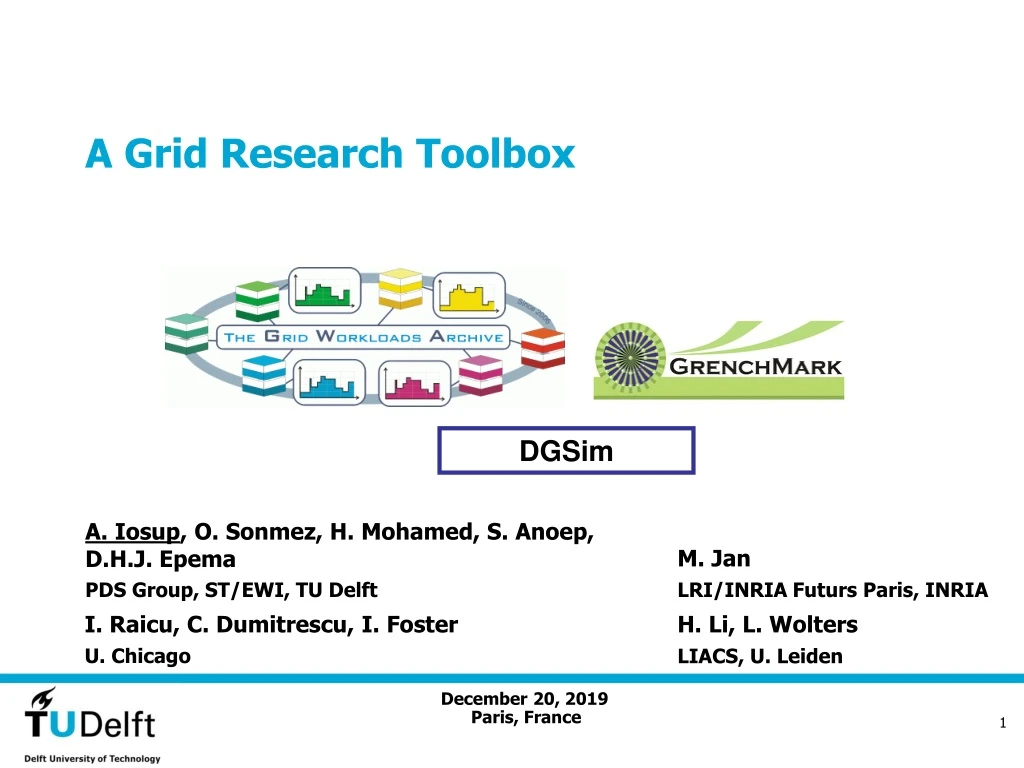
A Grid Research Toolbox. DGSim. A. Iosup , O. Sonmez, H. Mohamed, S. Anoep, D.H.J. Epema. M. Jan. PDS Group, ST/EWI, TU Delft. LRI/INRIA Futurs Paris, INRIA. I. Raicu, C. Dumitrescu, I. Foster. H. Li, L. Wolters. U. Chicago. LIACS, U. Leiden. Paris, France.

E N D
A Grid Research Toolbox • DGSim A. Iosup, O. Sonmez, H. Mohamed, S. Anoep, D.H.J. Epema M. Jan PDS Group, ST/EWI, TU Delft LRI/INRIA Futurs Paris, INRIA I. Raicu, C. Dumitrescu, I. Foster H. Li, L. Wolters U. Chicago LIACS, U. Leiden Paris, France
Grid Research: Science or Engineering? • When is work in grid computing science? • Studying systems to uncover their hidden laws • Designing innovative systems • Proposing novel algorithms • Methodological aspects: repeatable experiments to verify and extend hypotheses • When is work in grid computing engineering? • Showing that the system works in a common case, or in a special case of great importance (e.g., weather prediction) • When our students can do it (H. Casanova’s argument)
CERN LCG jobs 74.71% successful 25.29% unsuccessful Source: dboard-gr.cern.ch, May’07. Grids are far from being reliable job execution environments Server • 99.99999% reliable • 99.999% reliable Small Cluster So at the moment our students cannot work in grid computing engineering! Production Cluster • 5x decrease in failure rate after first year [Schroeder and Gibson, DSN‘06] DAS-2 • >10% jobs fail [Iosup et al., CCGrid’06] TeraGrid • 20-45% failures [Khalili et al., Grid’06] Grid3 • 27% failures, 5-10 retries [Dumitrescu et al., GCC’05]
Grid Research Problem: For ScienceWe Are Missing Both Data and Tools • Lack of data • Grid infrastructure • number and type of resources, resource availability and failures • Grid workloads • arrival process, resource consumption • … • Lack of tools • Simulators • SimGrid, GridSim, MicroGrid, GangSim, OptorGrid, MONARC, … • Testing tools that operate in real environments • DiPerF, QUAKE/FAIL-FCI • … We have problems to solve in grid computing (as a science)!
Research Questions Q1: How to exchange grid data?(e.g., Grid * Archive) Q2: What are the characteristics of grids? (e.g., infrastructure, workload) Q3: How to test and evaluate grids?
Outline • Introduction and Motivation • Meeting ALEAE Goals: A Grid Research Toolbox • Q1: Exchange Grid Data • The Grid Workloads Archive • Q2: Grid Characteristics • Grid Workloads • Grid Infrastructure • Q3: Grids Testing and Evaluation (not in this session)
ALEAE/AMOMI Goals • Provide models and algorithmic solutions in the field of resource management that cope with uncertainties in large-scale distributed systems. • Use experimental research to validate the proposed models and evaluate the algorithms using simulation or large-scale environments such as Grid’5000 in order to improve both models and algorithms.
A Grid Research Toolbox • Hypothesis: (a) is better than (b). For scenario 1, … 1 3 DGSim 2
Outline • Introduction and Motivation • Meeting ALEAE Goals: A Grid Research Toolbox • Q1: Exchange Grid Data • The Grid Workloads Archive • Q2: Grid Characteristics • Grid Workloads • Grid Infrastructure • Q3: Grids Testing and Evaluation (not in this session)
3.1. The Grid Workloads Archive [1/7]Motivation and Goals • Motivation: little is known about real grid use • No grid workloads (except “my grid”) • No standard way to share them • The Grid Workloads Archive: easy to share grid workload traces and research associated with them • Understand how real grids are used • Address the challenges facing grid resource management (both research and practice) • Develop and testgrid resource management solutions • Perform realistic simulations http://gwa.ewi.tudelft.nl A. Iosup, H. Li, M. Jan, S. Anoep, C. Dumitrescu, L. Wolters, D. Epema, The Grid Workloads Archive, FGCS 24, 672—686, 2008.
3.1. The Grid Workloads Archive [2/7]Content http://gwa.ewi.tudelft.nl 6 traces online 1.5 yrs >750K >250 A. Iosup, H. Li, M. Jan, S. Anoep, C. Dumitrescu, L. Wolters, D. Epema, The Grid Workloads Archive, FGCS 24, 672—686, 2008.
3.1. The Grid Workloads Archive [3/7]Presentation Many jobs Low utiliz. • Workload signature: simple six-category description • Easy to see which traces are fit/unfit for your experiment Signature Used? Comparewithothers. More detailedinformation A. Iosup, H. Li, M. Jan, S. Anoep, C. Dumitrescu, L. Wolters, D. Epema, The Grid Workloads Archive, FGCS 24, 672—686, 2008.
3.1. The Grid Workloads Archive [4/7]Approach • Standard data format (GWF) - Share traces with the community - Use extensions for specific modeling aspects - Text-based, easy to parse for custom tasks - Additional SQL-compatible data format (GWF-SQLite) • Automated trace analysis - Provide ready-to-use tools to the community - Promote results availability and comparability • Automated trace ranking - Help non-experts with their trace selection process • … A. Iosup, H. Li, M. Jan, S. Anoep, C. Dumitrescu, L. Wolters, D. Epema, The Grid Workloads Archive, FGCS 24, 672—686, 2008.
3.1. The Grid Workloads Archive [5/7]Approach: GWF Example Used Req Submit Wait[s] Run #CPUs Mem [KB] #CPUs A. Iosup, H. Li, M. Jan, S. Anoep, C. Dumitrescu, L. Wolters, D. Epema, The Grid Workloads Archive, FGCS 24, 672—686, 2008.
3.1. The Grid Workloads Archive [6/7]Approach: Standard Data Format (GWF) • Goals • Provide a unitary format for Grid workloads; • Same format in plain text and relational DB (SQLite/SQL92); • To ease adoption, base on the Parallel Workloads Format (SWF). • Existing • Identification data: Job/User/Group/Application ID • Time and Status: Sub/Start/Finish Time, Job Status and Exit code • Request vs. consumption: CPU/Wallclock/Mem • Added • Job submission site • Job structure: bag-of-tasks, workflows • Extensions: co-allocation, reservations, others possible A. Iosup, H. Li, M. Jan, S. Anoep, C. Dumitrescu, L. Wolters, D. Epema, The Grid Workloads Archive, FGCS 24, 672—686, 2008.
3.1. The Grid Workloads Archive [7/7]Approach: Automated Trace Analysis • General information • System-wide characteristics • Utilization • Job arrival rate • Job characteristics • Parallel vs. sequential jobs • User and group characteristics • Analysis for Top10 users • Analysis for Top10 groups • Performance • # running/waiting jobs • Throughput, # completed jobs
(End of Part I)Take Home Message • There is a need for making available grid traces • to drive the design of grid middleware components for resource-management • to test and benchmark (new) grid middleware components • to use as input for realistic simulation studies • The Grid Workloads Archive • Long-term grid traces, easy to select • Standard grid workload format (GWF), easy to use • Tools for automatic trace analysis • Add your traces! http://gwa.ewi.tudelft.nl
Outline • Introduction and Motivation • Meeting ALEAE Goals: A Grid Research Toolbox • Q1: Exchange Grid Data • The Grid Workloads Archive • Q2: Grid Characteristics • Grid Workloads • Grid Infrastructure • Q3: Grids Testing and Evaluation (not in this session)
Note: “Now” is June 2006 What do we expect from Grids?
What do we expect from grids? (1/3) • Goal: Grid systems will be dynamic, heterogeneous, very large-scale (world), and have no central administration • The all users are interested assumption: Grids support many VOs, many users, and they all use the grid intensively • The 0-day learning curve assumption: a grid must support many different projects in a way that facilitates an immediate jump to productivity The theory sounds good, but how about the practice? Let’s look at Real Grid Traces!
What do we expect from grids? (2/3)Grids vs. Parallel Production Envs. • The HPC successor assumption: the Grid’s typical user comes from the HPC world, and the typical workload can be described with well-known models of parallel production environments workloads • We will have from the beginning lots of parallel jobs • We will have from the beginning lots of power-of-2 sized jobs • We will handle from the beginning tightly-coupled parallel jobs • The infinite power assumption: the Grid can deliver any computing power demand, and in particular will offer at least computing power comparable to traditional Parallel Production Environments Promising in theory, but how about in practice? Let’s look at Real Grid Traces!
What do we expect from grids? (3/3)Grid Computing Works! • The Power of Sums is Greater Than the Sum of Powers assumption: by coupling individual environments the Grid will provide better performance than by using the individual environments alone • Higher throughput • Shorter wait times • Shorter response times • Same or lower jobs slowdown • There is a need for the Power of Sums assumption: institutions have the will and the need to couple their environments into a larger, grid-based, environment I’m sure it’s true, but what happens in practice? Let’s look at Real Grid Traces!
The Grid Traces: LCG, Grid3, TeraGrid, the DAS • Production Grids: LCG, Grid3, TeraGrid • Academic Grid: the DAS (two overlapping traces: local, and shared as Grid platform) • Features: long traces (6+ months), active environments (500+K jobs per trace, 100s of users)
Trace Analysis:System-Wide Characteristics • System utilization is on average 60-80% for production Grids, and <20% for academic Grids • Average job size is 1 (that is, there are no [!] tightly-coupled, only conveniently parallel jobs)
Trace Analysis:VO, Group, and User Characteristics • Top 2-5 groups/users dominate the workload • Top groups/users are constant submitters • The week’s top group/user is not always the same
Trace Analysis:Evolution of Grid Environments • Everything evolves! The infrastructure, the projects, and the users • Similar submission patterns • Stages automated tool learning cool-down phase production phase
What did we expect from grids? (1/3) • The all users are interested assumption: Grids support many VOs, many users, and they all use the grid intensively • The 0-day learning curve assumption: a grid must support many different projects in a way that facilitates an immediate jump to productivity
What did we expect from grids? (1/3) … and what have we observed • The all users are interested assumption: Grids support many VOs, many users, and they all use the grid intensively (top 2-5 groups/users dominate the workload) • The 0-day learning curve assumption: a grid must support many different projects in a way that facilitates an immediate jump to productivity
What did we expect from grids? (1/3) … and what have we observed • The all users are interested assumption: Grids support many VOs, many users, and they all use the grid intensively (top 2-5 groups/users dominate the workload) • The 0-day learning curve assumption: a grid must support many different projects in a way that facilitates an immediate jump to productivity(learning curves of up to 60 days, 100 days for an automated tool development)
What did we expect from grids? (2/3)Grids vs. Parallel Production Envs. • The HPC successor assumption: the Grid’s typical user comes from the HPC world, and the typical workload can be described with well-known models of parallel production environments workloads • We will have from the beginning lots of parallel jobs • We will have from the beginning lots of power-of-2 sized jobs • We will handle from the beginning tightly-coupled parallel jobs • The infinite power assumption: the Grid can deliver any computing power demand, and in particular will offer at least computing power comparable to traditional Parallel Production Environments
Grids vs. Parallel Production Envs.… and what have we observed • The HPC successor assumption: the Grid’s typical user comes from the HPC world, and the typical workload can be described with well-known models of parallel production environments workloads • No parallel jobs • No power-of-2 sized jobs • No tightly-coupled parallel jobs • The infinite power assumption: the Grid can deliver any computing power demand, and in particular will offer at least computing power comparable to traditional Parallel Production Environments
Grids vs. Parallel Production Envs.… and what have we observed • The HPC successor assumption: the Grid’s typical user comes from the HPC world, and the typical workload can be described with well-known models of parallel production environments workloads • No parallel jobs • No power-of-2 sized jobs • No tightly-coupled parallel jobs • The infinite power assumption: the Grid can deliver any computing power demand, and in particular offers at least computing power comparable to traditional Parallel Production Environments
Grid Computing @ Works… and what have we observed • The Power of Sums is Greater Than the Sum of Powers assumption: by coupling individual environments the Grid will provide better performance than by using the individual environments alone • Higher throughput • Shorter wait times • Shorter response times • Same or lower jobs slowdown • There is a need for the Power of Sums assumption: institutions have the will and the need to couple their environments into a larger, grid-based, environment
Grid Computing @ Works… and what have we observed • The Power of Sums is Greater Than the Sum of Powers assumption: by coupling individual environments the Grid will provide better performance than by using the individual environments alone • Higher throughput (as predicted) • Reality: much higher wait times(NOT as predicted) • Shorter response times • Reality: for short jobs much higher job slowdown(NOT as predicted) • There is a need for the Power of Sums assumption: institutions have the will and the need to couple their environments into a larger, grid-based, environment
Grid Computing @ Work… and what have we observed • The Power of Sums is Greater Than the Sum of Powers assumption: by coupling individual environments the Grid will provide better performance than by using the individual environments alone • Higher throughput (as predicted) • Reality: much higher wait times(NOT as predicted) • Shorter response times • Reality: for short jobs much higher job slowdown(NOT as predicted) • There is a need for the Power of Sums assumption:(there already is a large community using them!)
4.1. Grid Workloads [1/4]Analysis Summary:Grid workloads different, e.g., from parallel production envs. • Traces: LCG, Grid3, TeraGrid, and DAS • long traces (6+ months), active environments (500+K jobs per trace, 100s of users), >4 million jobs • Analysis • System-wide, VO, group, user characteristics • Environment, user evolution • System performance • Selected findings • Almost no parallel jobs • Top 2-5 groups/users dominate the workloads • Performance problems: high job wait time, high failure rates A. Iosup, C. Dumitrescu, D.H.J. Epema, H. Li, L. Wolters, How are Real Grids Used? The Analysis of Four Grid Traces and Its Implications, Grid 2006.
4.1. Grid Workloads [2/4]Analysis Summary: Grids vs. Parallel Production Systems LCG cluster daily peak: 22.5k jobs • Similar CPUTime/Year, 5x larger arrival bursts Grids Parallel Production Environments (Large clusters, supercomputers) A. Iosup, D.H.J. Epema, C. Franke, A. Papaspyrou, L. Schley, B. Song, R. Yahyapour, On Grid Performance Evaluation using Synthetic Workloads, JSSPP’06.
4.1. Grid Workloads [3/4]More Analysis: Special Workload Components Workflows (WFs) Bags-of-Tasks (BoTs) Time [units] BoT = set of jobs… WF = set of jobs with precedence(think Direct Acyclic Graph) …that start at most Δs after the first job Parameter Sweep App. = BoT with same binary
4.1. Grid Workloads [3/4]BoTs are predominant in grids • Selected Findings • Batches predominant in grid workloads; up to 96% CPUTime • Average batch size (Δ≤120s) is 15-30 (500 max) • 75% of the batches are sized 20 jobs or less A. Iosup, M. Jan, O. Sonmez, and D.H.J. Epema, The Characteristics and Performance of Groups of Jobs in Grids, Euro-Par, LNCS, vol.4641, pp. 382-393, 2007.
4.1. Grid Workloads [3/4]Workflows exist, but they seem small • Traces • Selected Findings • Loose coupling • Graph with 3-4 levels • Average WF size is 30/44 jobs • 75%+ WFs are sized 40 jobs or less, 95% are sized 200 jobs or less S. Ostermann, A. Iosup, R. Prodan, D.H.J. Epema, and T. Fahringer. On the Characteristics of Grid Workflows, CoreGRID Integrated Research in Grid Computing (CGIW), 2008.
4.1. Grid Workloads [4/4]Modeling Grid Workloads: Feitelson adapted • Adapted to grids: percentage parallel jobs, other values. • Validated with 4 grid and 7 parallel production env. traces A. Iosup, D.H.J. Epema, T. Tannenbaum, M. Farrellee, and M. Livny. Inter-Operating Grids Through Delegated MatchMaking, ACM/IEEE Conference on High Performance Networking and Computing (SC), pp. 13-21, 2007.
4.1. Grid Workloads [4/4]Modeling Grid Workloads: adding users, BoTs • Single arrival process for both BoTs and parallel jobs • Reduce over-fitting and complexity of “Feitelson adapted” by removing the RunTime-Parallelism correlated model • Validated with 7 grid workloads A. Iosup, O. Sonmez, S. Anoep, and D.H.J. Epema. The Performance of Bags-of-Tasks in Large-Scale Distributed Systems, HPDC, pp. 97-108, 2008.
Outline • Introduction and Motivation • Meeting ALEAE Goals: A Grid Research Toolbox • Q1: Exchange Grid Data • The Grid Workloads Archive • Q2: Grid Characteristics • Grid Workloads • Grid Infrastructure • Q3: Grids Testing and Evaluation (not in this session)
4.2. Grid Infrastructure [1/3]Existing resource models and data • Compute Resources • Commodity clusters[Kee et al., SC’04] • Desktop grids resource availability[Kondo et al., FCFS’07] • Network Resources • Structural generators: GT-ITM [Zegura et al., 1997] • Degree-based generators: BRITE [Medina et al., 2001] • Storage Resources, other resources • ? Static! Resource dynamic, evolution, … NOT considered Source: H. Casanova
Grid-level availability: 70% 4.2. Grid Infrastructure [2/3]Resource dynamics in cluster-based grids • Environment: Grid’5000 traces • jobs 05/2004-11/2006 (30 mo., 950K jobs) • resource availability traces 05/2005-11/2006 (18 mo., 600K events) • Resource availability model for multi-cluster grids A. Iosup, M. Jan, O. Sonmez, and D.H.J. Epema, On the Dynamic Resource Availability in Grids, Grid 2007, Sep 2007.
4.2. Grid Infrastructure [2/3] Correlated Failures • Correlated failure Maximal set of failures (ordered according to increasing event time), of time parameter in which for any two successive failures E and F, where returns the timestamp of the event; = 1-3600s. • Grid-level view • Range: 1-339 • Average: 11 • Cluster span • Range: 1-3 • Average: 1.06 • Failures “stay” within cluster Average CDF Grid-level view Size of correlated failures A. Iosup, M. Jan, O. Sonmez, and D.H.J. Epema, On the Dynamic Resource Availability in Grids, Grid 2007, Sep 2007.
see article for per-cluster parameter values 4.2. Grid Infrastructure [2/3] Dynamics Model MTBF MTTR Correl. • Assume no correlation of failure occurrence between clusters • Which site/cluster? • fs, fraction of failures at cluster s • Weibull distribution for IAT • Shape parameter > 1: increasing hazard ratethe longer a node is online, the higher the chances that it will fail A. Iosup, M. Jan, O. Sonmez, and D.H.J. Epema, On the Dynamic Resource Availability in Grids, Grid 2007, Sep 2007.