Download
1 / 31
310 likes | 434 Views
More on Parametric and Nonparametric Population Modeling: a brief Summary. Roger Jelliffe, M.D. USC Lab of Applied Pharmacokinetics

E N D
More on Parametric and Nonparametric Population Modeling: a brief Summary Roger Jelliffe, M.D. USC Lab of Applied Pharmacokinetics See also Clin PK, Bustad A, Terziivanov D, Leary R, Port R, Schumitzky A, and Jelliffe R: Parametric and Nonparametric Population Methods: Their Comparative Performance in Analysing a Clinical Data Set and Two Monte Carlo Simulation Studies. Clin. Pharmacokinet., 45: 365-383, 2006.
InTER-Individual Variability • The variability between subjects in a population. • Usually a single number (SD, CV%) in parametric population models • But there may be specific subpopulation groups • eg, fast, slow metabolizers, etc. • How describe all this with one number? • What will you DO with it?
InTRA-Individual Variability • The variability within an individual subject. • Assay error pattern, plus • Errors in Recording times of samples • Errors in Dosage Amounts given • Errors in Recording Dosage times • Structural Model Mis-specification • Unrecognized changes in parameter values during data analysis. • How describe all this with one number? • How describe interoccasional variability only with one number? • What will you DO with these numbers?
Nonparametric Population Models (1) • Get the entire ML distribution, a DiscreteJoint Density: one param set per subject, + its prob. • Shape of distribution not determined by some equation, only by the dataitself. • Multiple indiv models, up to one per subject. • Can discover, locate, unsuspected subpopulations. • Get F from intermixed IV+PO dosage.
Nonparametric Population Models (2) • The multiple models permit multiple predictions. • Can predict precision of goal achievement by a dosage regimen. • Behavior is consistent. • Use IIV +/or assay SD, stated ranges.
What is the IDEAL Pop Model? • The correct structural PK/PD Model. • The collection of each subject’s exactly known parameter values for that model. • Therefore, multipleindividualmodels, one for each subject. • Usual statistical summaries can also be obtained, but usually will lose info. • How best approach this ideal? NP!
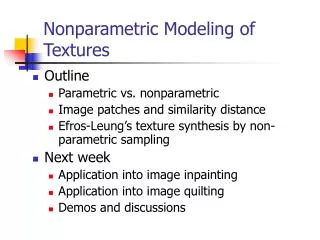
NPEM can find sub-populations that can be missed by parametric techniques Smoothed empirical density of 20 samples from true density True two-parameter density
NPEM vs. parametric methods, cont’d Best parametric representation using normality assumption Smoothed NPEM results
The Clinical Population - 17 patients, 1000mg Amikacin IM qd for 6 days • Seventeen patients • 1000 mg Amikacin IM qd for 5 doses • 8-10 levels per patient, usually 4-5 on day 1-2, and 4-5 on day 5-6, • Microbiological assay, • SD = 0.12834 + 0.045645 x Conc • Ccr range - 40-80 ml/min/1.73 M2
Getting the Intra-individual variability IIV = Gamma x (assay error SD polynomial) so, IIV = Gamma x (0.12834 + 0.045645 x Conc) Gamma = 3.7
Amikacin - Parameterization as Ka, Vs, and Ks IT2B NPEM NPAG With Med/CV% Ka 1.352/4.55 1.363/20.42 1.333/21.24 Vs .2591/13.86 .2488/17.44 .2537/17.38 Ks .003273/14.83 .003371/15.53 .003183/15.76
Amikacin - Log Likelihood, Ka, Vs, and Ks, with and without gamma IT2B NPEM NPAG No Log - Lik -809.996 -755.111 -748.295 With Log - Lik -389.548 -374.790 -374.326
Estimates from Pop Medians, Ka, Vs, Ks parameterization, no / • IT2B NPEM NPAG • r2 = .814/.814 .876/.879 .877/.880 • ME = .979/-.575 -.584/-.751 -0.367/.169 • MSE = 55.47/48.69 28.96/29.01 29.06/29.70
Conclusions All parameter values pretty similar Less variation seen with IT2B But log likelihood the least NPEM, NPAG more likely param distribs No spuriously high param correlations NPAG most likely param distributions NPEM, NPAG best suited for MM dosage NPEM, NPAG are consistent, precise.
New - Non-parametric adaptive grid algorithm (NPAG) • Initiate by solving the ML problem on a small grid • Refine the grid around the solution by adding perturbations in each coordinate at each support point from optimal solution at previous stage • Solve the ML problem on the refined grid (this is a small but numerically sensitive problem) • Iterate solve-refine-solve cycle until convergence, using decreasing perturbations • Best of both worlds - improved solution quality with far less computational effort!
NPAG outperforms NPEM by a large factor • CPU TIME MEMORY LOG-LIK • (HRS) (MB) • NPEM: 2037 10000 -433.1 • NPAG: 1.7 6 -433.0 • NPEM run was made at SDSC on 256 processors of Blue Horizon, an IBM SP parallel supercomputer that was then the most powerful non-classified computer in the world • NPAG run was made on a single 833 MHz Dell PC
Leary – A Simulation Study • One compartment model h(V,K) = e-Kt/V with unit intravenous bolus dose at t=0 • Five parameters in N(m,S): mV=1.1, mK=1.0sV=0.25, sK =0.25, r= –0.6, 0.0, and +0.6 • 1000+ replications to evaluate bias and efficiency • N=25, 50, 100, 200, 400, 800 sample sizes • Two levels (moderately data poor) with 10% observational error
Consistency of estimators of V-K correlation coefficient (true value r = -0.6)
Consequence #1 of using F.O.C.E approximation– loss of consistency • small (1-2%) bias for mV, mK • moderate (20 – 30%) bias for sV, sK • severe bias for correlations true value average estimate
Statistical efficiencies of NPAG and PEM are much higher than IT2B
Asymptotic stochastic convergence rate of IT2B is 1/N1/4 vs. 1/N1/2 for NPAG and P-EM
NONMEM FOCE does better, but still has less than 40% efficiency relative to exact ML methods
Consequences of usingF.O. and F.O.C.E approximations versus exact likelihoods • Loss of consistency • Severe loss of statistical efficiency • Severe reduction of asymptotic convergence rate : • need 16 X the number of subjects to reduce the SD of IT2B estimator by factor of 2, • vs. 4 X for NPAG and PEM, as theory says
Efficiency and Relative Error • EstimatorRel EfficiencyRel Error • Direct observation 100.0% 1.00 • PEM 75.4% 1.33 • NPAG 61.4% 1.63 • NONMEM FOCE 29.0% 3.45 • IT2B FOCE 25.3% 3.95 • NONMEM FO 0.9% 111.11