Download
1 / 38
390 likes | 521 Views
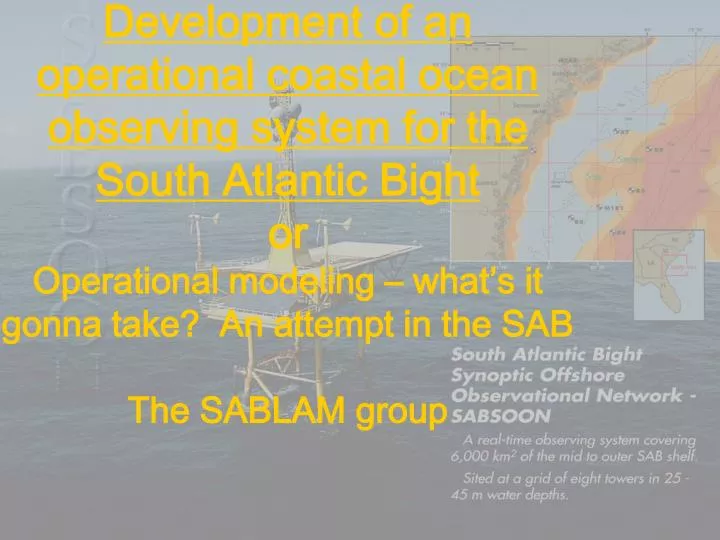
Development of an operational coastal ocean observing system for the South Atlantic Bight or Operational modeling – what’s it gonna take? An attempt in the SAB The SABLAM group. SABLAM Group (NOPP, 2000). Dartmouth : Dan Lynch, [Chris Naimie], Keston Smith, Jeff Proehl

E N D
Development of an operational coastal ocean observing system for the South Atlantic BightorOperational modeling – what’s it gonna take? An attempt in the SABThe SABLAM group
SABLAM Group (NOPP, 2000) • Dartmouth: Dan Lynch, [Chris Naimie], Keston Smith, Jeff Proehl • UNC-CH: Cisco Werner, Rick Luettich, Brian Blanton, Alfredo Lopez de Aretxabaleta, Luke Stearns, Harvey Seim • WHOI: Dennis McGuillicuddy • SkIO: Jim Nelson, Trent Moore • [MCNC: Eric Sills] • JAX, CHA WFO: Pat Welsh, [Stephen Brueske] [ ] – no longer participating
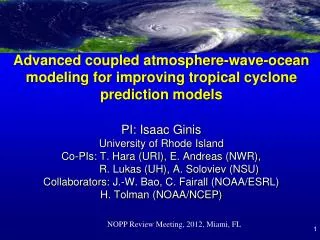
SABLAM Objective To develop a portable, limited-area modeling system that provides an operational forecast of conditions in the coastal ocean that includes the influence of tides, local air-sea interactions, buoyancy and remote forcing. Tall order. Requires….
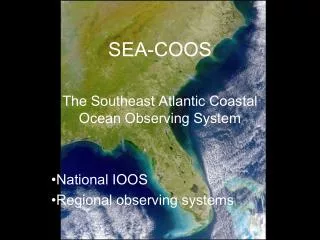
A coastal ocean observing system Modeling perspective Initialization • Climatology • Eventually, (soon) HYCOM/GODAE
Nested Meteorological/Ocean Models ADCIRC Domain Far-Field Tide and Wind-Band Forcing AWIP 32 Domain 10 km ETA Met. Model SAB Climatology HYCOM or COFS Baroclinic/Gulf Stream Forcing SABLAM Domain QUODDY TRUXTON/CASCO Limited-Area Shelf Models, Data Assimilative High Resolution, Regional ETA Model Improved Air/Sea Interaction
Will examine some of the stumbling blocks encountered in SABLAM: Getting a good prior Barotropic dynamics: tidal, weather band, lower frequency Baroclinic dynamics (density field): from climatology, SST/in-situ obs, basin-scale models Assimilation - a technique to minimize difference between sparse observations and simulated fields Three components: frequency domain inverse, time domain inverse, objective analysis
Barotropic tides: should be straightforward… • Finite Element • 2D (ADCIRC) • Time-dependent • Fully Nonlinear • Elev. BCs from • Global FES95D Performs well except in SAB
Problem: typical coastal tide stationis not “in” the typical shelf model domain Fort Pulaski, GA Landward Bndy of Operational models
In the SAB large sections of the coastline are backed by extensive estuaries No Estuary Boundary
This coastal geometry is concentrated between central SC and north FL “No Estuary” Boundary
M2 Elevation Prior without estuaries – tide experiences two-fold amplitude increase and notable phase change NC SC GA FL • Finite Element • Nonlinear • 2D (ADCIRC) • Western North Atl. • Crossshelf Amplification • Equatorward phase propagation • Latest phase along GA/FL border • Shelf response sensitive
M2 Obs Vs. Prior, without Estuaries Amplitude (m) Phase (deg) Larger phase error closer to shore
M2 Obs Vs. Prior, with Estuaries Amplitude (m) Phase (deg) Substantially reduced phase error closer to shore
M2 Phase Comparison RED = without Estuaries BLUE = with Estuaries
RED = without estuaries BLUE = with estuaries FL
Implication: different M2 energy flux required to support estuarine dissipation Operationally: need unstructured grids or true two- way coupling to accurately represent tide along this type of coastline
Nontidal prior response – from 2D wind-forced model of western North Atlantic. Comparison of detided CSL at Mayport, FL Observed CSLModeled CSL
Weather-band (<15 day) comparison favorable; some under-estimate during large events… Observed CSLModeled CSL
Consistent with under- estimate of longshore winds seen in ETA predictions (cross-shore and temps look OK)
At lower frequencies (>15 day) the comparison is less favorable; see some 25 cm offsets; partly steric but… Observed CSLModeled CSL
Blaha, JGR ’84 (?)found coherent monthly averagedsea level variationsover SAB (’55-’75 period, heatingand atmos. presseffects removed).Can be more than 20 cm variation annually. Postulated due toGulf Stream transportvariations.
Noble/Gelfenbaum – modeled coastal SL impact of GS transport variations. Low transport Gulf Stream Average transport Coast Offshore Fixed “Hinge” Low transport, higher CSL Shelf Gulf Stream Average transport Coast High transport Offshore Fixed “Hinge” High transport, lower CSL Shelf
Climatology (3) Objective analysis digital analog to Atkinson et.al. (1983)
Climatology (5) Cross-shelf Structure from Objective Analysis TEMP SALN st
Climatology (7) Monthly Mean COADS Winds Only Monthly Baroclinic Solution Winds + BC
Climatology … Charleston Bump ½ x ½ deg squares Bottom depth: <400m >400m
Micom D180 • Midsummer • Reanalysis • Unrealistic upwelling
Data Assimilative Loop (1) Wind+Tide Data Assimilation System
Data Assimilative Loop (2) Far-Field computation of Wind+Tide
SABSOON/SABLAM Data NC SC East Coast Domain for Tidal/Wind-Driven BCs for Limited-Area Mesh Nested SABLAM Mesh for Hindcast/Forecast System Obs. Locations: Water Level SABSOON ADCP 25m 50m 200m GA 3000m 1000m FL
M2 Phase Comparison RED = W/O Estuaries BLUE = W/ Estuaries GA >3 Phase Diff. FL
Lower Mean Sealevel Noble/Gelfenbaum Gulf Stream Average Transport Coast Higher Transport Offshore Fixed “Hinge” Shelf Increased Transport Increased Cross-stream Slope LOWER Coastal Sea level
Higher Mean Sealevel Noble/Gelfenbaum Gulf Stream Lower Transport Coast Offshore Fixed “Hinge” Average Transport Shelf Decreased Transport Decreased Cross-stream Slope HIGHER Coastal Sealevel