Download
1 / 13
130 likes | 228 Views
W.W. Xiao1), X.T. Ding1), X.L. Zou2) , Z.T. Liu1), Y.D. Gao1) , J.Q. Dong1), L.H. Yao1), B.B. Feng1), X.M. Song1), S.D. Song2), Y. Zhou1), C.Y. Chen1), L.W. Yan1), Q.W. Yang1), Yi Liu1), X.R. Duan1), C.H. Pan1), Yong Liu1). 1)Southwestern Institute of Physics(SWIP), Chengdu, China

E N D
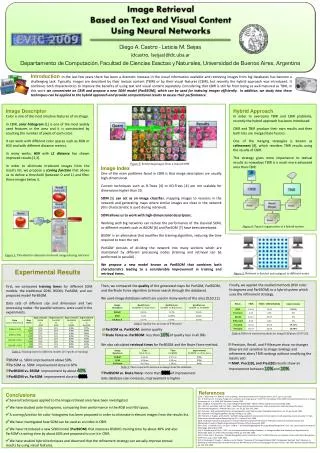
W.W. Xiao1), X.T. Ding1), X.L. Zou2) , Z.T. Liu1), Y.D. Gao1) , J.Q. Dong1), L.H. Yao1), B.B. Feng1), X.M. Song1), S.D. Song2), Y. Zhou1), C.Y. Chen1), L.W. Yan1), Q.W. Yang1), Yi Liu1), X.R. Duan1), C.H. Pan1), Yong Liu1) 1)Southwestern Institute of Physics(SWIP), Chengdu, China 2)Association Euratom-CEA, CEA/DSM/IRFM,CEA/Cadarache, 13018 St Paul-lez-Durance, France New Experimental Results Obtained using Microwave Reflectometryin HL-2A Tokamak IRW9 (Lisbon, Portugal) 4-6th May 2009, W.W. Xiao 1
Outline • Plasma density perturbation • Particle source position confirm • Particle transport coefficients using analysis code • Plasma rotation profils • Summary and outlook IRW9 (Lisbon, Portugal) 4-6th May 2009, W.W. Xiao 2
Plasma density perturbation In shot 3875, the density perturbation at different minor radius during the pulse molecular beam injection. Ip=349 kA, =2.3 T, from the top down r=26.5,27,28,29,30,31,32,33,34,35 and 36 cm.[1] IRW9 (Lisbon, Portugal) 4-6th May 2009, W.W. Xiao 3
The contour image of the density variational ratio with discharge time in different radii, for shot 3875 Comparative results of the Ha intensity profile and the phase profile for shots 3825 (the close square) and 3875 (the close circular) in the similar discharge conditions. The particle source deposition place is about r~28cm.[1] Particle source position confirm IRW9 (Lisbon, Portugal) 4-6th May 2009, W.W. Xiao 4
The experimental and simulations results in different source width, shot 3875. [2] Particle transport simulation IRW9 (Lisbon, Portugal) 4-6th May 2009, W.W. Xiao 5
The diffusion coefficients and the convection velocities profiles in different domains, A,B and C for shot 3875. [2] In shot 3875, Ln~5-50cm for region r~26-30cm. The blue region is better than that in the red region as shown in above picture. Particle transport coefficients D & V IRW9 (Lisbon, Portugal) 4-6th May 2009, W.W. Xiao 6
simulation for the shot 7543 about the sensitivity to D & V (A) (B) (C) f0=9.6 Hz, rdep=27.5 cm; Domain I: D1=0.2 m2/s, V1=-0.05m/s Domain II: D2=0.25m2/s, V2=-2.2m/s; Domain III: D3=0.25 m2/s, V3=-4.2m/s Sensitivity to D & V I II III I II III I II III IRW9 (Lisbon, Portugal) 4-6th May 2009, W.W. Xiao 7
Plasma rotation in HL-2A One multi-step Doppler reflectometry system has been operated first time in HL-2A tokamak, 26.5-40GHz, O-Mode, homodyne. Time evolution of the line-averaged density for shot 8655. (a) The line average density of 1.9×10¹⁹m-3. (b) The control voltage for microwave frequency of the Doppler reflectometry system. (c) The initial signal from the Doppler system. [3] IRW9 (Lisbon, Portugal) 4-6th May 2009, W.W. Xiao 8
Shot: 7243 Profile ○: 240ms, no barrier, the density is lower than 2.210e19m-3 Profiles 1, 2, 3 and 4 as shown in above figure, a stable barrier formed. Switch off the gas feed & density profile IRW9 (Lisbon, Portugal) 4-6th May 2009, W.W. Xiao 9
Poloidal cross-section showing O-mode (solid line)cut-off surfaces at 26, 35.8 and 37.7 GHz for shot 8614 (Bt = 1.56T, nl = 2.8×10¹⁹m-3) with antenna lines of sight. Dashed curves are ray-tracing predictions from REMA code. One can estimate similar circular cross section for the plasma shape. Ray-trace analysis in HL-2A IRW9 (Lisbon, Portugal) 4-6th May 2009, W.W. Xiao 10
Plasma rotation profiles in different density Radial profiles of the E×B flow velocity in different line average densities. The E×B flow velocity increases in the range 24<r <36 cm in shot 8655, line average density is about 1.9×10¹⁹m-3. A drastic change of the E×B flow velocity in the range 28<r<30cm in shots 8618 (nl~2.6×10¹⁹m-3), and 8614 (nl~2.8×10¹⁹m-3). The dashed line shows the position of the velocity change. IRW9 (Lisbon, Portugal) 4-6th May 2009, W.W. Xiao 11
Ln during different density IRW9 (Lisbon, Portugal) 4-6th May 2009, W.W. Xiao 12
Summary and Outlook • Particle transport studies using microwave reflectometry and SMBI is a good method because of the local particle source can be induced by the SMBI. • The particle source position has been confirm in different ways Ha and the dn/dt. • The particle transport coefficients, D and V have been obtained using the analysis code[2]. • Plasma rotation profiles have been measured in HL-2A,and the plasma rotation profile will be changed even in pure Ohmic discharge. • Next step experiments will be done during H-mode phase in HL-2A tokamak. [1]Yao Lianghua et al., Nucl. Fusion, 47 (2007) 1399 [2]S.P. Eury et al., Phys. Plasmas, 12 (2005) 102511 [3]W.W. Xiao, X.L. Zou, X.T. Ding, et al., Chin. Phys. Lett., 26 (2009) 035201 IRW9 (Lisbon, Portugal) 4-6th May 2009, W.W. Xiao 13