Download
1 / 6
70 likes | 169 Views
Overview of pricing model & service offering tool. The tool supports end to end quotation management process from RFP RFQ The tool is built in a very flexible model where organization can define various parameters depending on the industry/service offering Refer slide 5

E N D
The tool supports end to end quotation management process from RFP RFQ • The tool is built in a very flexible model where organization can define various parameters depending on the industry/service offering Refer slide 5 • Flexibility in capturing the costs in different currencies • Provision to choose target pricing currency • Automatic conversion of all currencies to target currency based on the ‘day’ Forex rates or agreed conversion rates can be updated • Option to choose the nature of service offering like T&M, fixed price or output based pricing • The pricing model tool can be built based on chosen service offering or the tool will compute the pricing in various models & publish the cost benefit analysis for each offering/model • Application portfolio analysis complexity, no. of users, value measures, level of incidents etc • Resourcing portfolio analysis career levels, pyramid, ACOL etc • Industry standard output measures turn around time (TAT) etc Salient features Ceaselez Consulting LLP
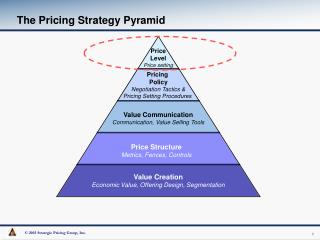
To identify all the components that contributes to delivery/production cost • Segregate the actual productive cost, non-productive costs & other costs that constitutes the overall cost • This is illustrated in the diagram below Eg: Application Management services Effort per unit + Training & KT + ServiceManagement Productive Effort Down-time + Holiday, Sick, Bench Non-productive Effort Objectives Delivery/Production Cost Delivery/Production Risk Risk Miscellaneous Expenses + hardware / software + support services / 3rd party Others Ceaselez Consulting LLP
The professional & other costs are maintained/consolidated at global level • This is illustrated in the diagram below Eg: Application Management services ON 1 ON 3 ON 2 ONSHORE PRODUCTION CENTERS ON 4 COST NE 1 NE 2 NEAR SHORE PRODUCTION CENTERS COST Overview of scope OF 2 OF 1 OF 3 OFFSHORE PRODUCTION CENTERS COST TOTAL COST Ceaselez Consulting LLP
Example - Parameters for computation Ceaselez Consulting LLP
Selection of raw material mix in various composition • Automated standard ‘material balance’ computation for output • Sensitivity analysis in applying different composition for each raw material based on pre-defined levels • Computing material balance for each combination • Arriving at cost of production for each combination • Computing the net combination quoted price less total cost of production • Publishing the report in descending order of net contribution • The model works • Production Sales • Production Customer order How it works in Manufacturing industry - Example Ceaselez Consulting LLP