Download
1 / 21
210 likes | 270 Views
P lease get out your completed 8.2B Graphing Worksheet 2 and pass it to the center aisle to be collected by the TA.

E N D
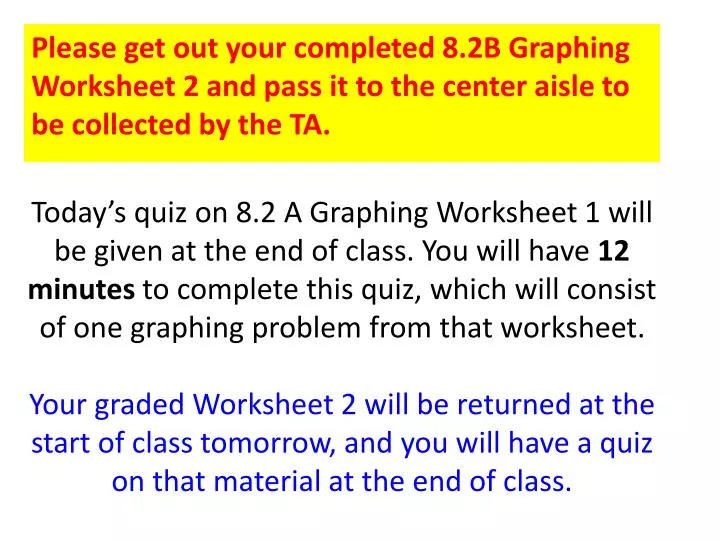
Please get out your completed 8.2B Graphing Worksheet 2 and pass it to the center aisle to be collected by the TA. Today’s quiz on 8.2 A Graphing Worksheet 1 will be given at the end of class. You will have 12 minutes to complete this quiz, which will consist of one graphing problem from that worksheet. Your graded Worksheet 2 will be returned at the start of class tomorrow, and you will have a quiz on that material at the end of class.
Teachers: After you return Worksheet 1, you might want to spend a few minutes going over any common errors you noticed while reviewing your students’ worksheets before you start the lecture for section 4.1. Please remember that you’ll need to wind up your lecture with about 15 minutes remaining so that students will have time to open and complete the 12-minute quiz. This quiz has a special answer sheet with a graphing grid, so please make sure your TA hands out the correct answer sheet for today’s quiz.
Please CLOSE YOUR LAPTOPS, and turn off and put away your cell phones, and get out your note-taking materials.
Section 4.1Solving Systems of Equations in Two Variables by Graphing • A system of linear equations consists of two or more linear equations. • This section focuses on only two equations at a time. • The solution of a system of linear equations in two variables is any ordered pair that solves both of the linear equations.
What does this look like on a graph? • The SOLUTION to a system of two linear equations is the intersection (if any) of the two lines. • There are only three possible solution scenarios: • The lines intersect in a single point (so the answer is one ordered pair). • The lines don’t intersect at all, i.e. they are parallel (so the answer is “no solution”.) • The two lines are identical, i.e. coincident, so there are infinitely many solutions (all of the points that fall on that line.)
To be a SOLUTION of a system of equations, an ordered pair must result in true statements for BOTH equations when the values for x & y are plugged into them. If either one (or both) gives a false statement, the ordered pair is NOT a solution of the system.
Example Determine whether the given point is a solution of the following system. point: (-3, 1) system: x – y = -4 and 2x + 10y = 4 • Plug the values into the equations. First equation: -3 – 1 = -4 true Second equation: 2(-3) + 10(1) = -6 + 10 = 4 true • Since the point (-3, 1) produces a true statement in bothequations, it is a solution.
Example Determine whether the given point is a solution of the following system point: (4, 2) system: 2x – 5y = -2 and 3x + 4y = 4 • Plug the values into the equations First equation: 2•4 - 5•2 = 8 – 10 = -2 true Second equation: 3•4 + 4•2 = 12 + 8 = 20 4 false • Since the point (4, 2) produces a true statement in only one equation, it is NOT a solution.
Problem from today’s homework: (try this one in your notebook) x = 3 and y = 5 works in the first equation, but not in the second one.
Since a solution of a system of equations is a solution common to both equations, it would also be a point common to the graphs of both equations. • One way to find the solution of a system of 2 linear equations is to graph the equations and see where the lines intersect. • You can use any of the techniques from Chapter 3 to graph the two lines (e.g. solving each equation for y and using the slope and intercept, or making a table of x- and y-values for each equation and plotting the ordered pairs.)
Graphing is the first of three methods for solving systems of equations that we will be studying in this chapter. The other two methods we will be using are: • Substitution method (Section 4.2) • Addition or elimination method (Section 4.3)
Note: Graph Paper Click on the “Announcements” button to find a site that allows you to print free graph paper. • If you want to be able to draw accurate graphs but you don't want to buy a whole pack of graph paper for one assignment, go to this web site and print a couple pages of graph paper for free. (You don’t have to do this – graphing by hand on plain paper is fine, but sometimes it’s easier to see the solutions if you can plot your points carefully on real graph paper instead of a hand-drawn graph grid.) http://www.printfree.com/Office_forms/GraphPaper2.htm
y (4, 2) (1, 3) x (1, -4), (0, -6) Example: Solve the following system of equations by graphing: 2x – y = 6 and x + 3y = 10 • First, graph 2x – y = 6. • Solving for y gives y = 2x – 6. • Plot the y-intercept of -6, then use the slope of 2 to go up two, over one. • Second, graph x + 3y = 10. • Solving for y gives y = -1/3x + 10/3. • The y-intercept is a fraction, so let x = 1; then y = -1/3 + 10/3 = 9/ 3 = 3. • Plot (1,3), then use the slope of -1/3 to go down one, over three. The lines APPEAR to intersect at (4, 2).
Example (cont.) Although the solution to the system of equations appears to be (4, 2), you still need to check the answer by substituting x = 4 and y = 2 into the two equations. First equation, 2(4) – 2 = 8 – 2 = 6 true Second equation, 4 + 3(2) = 4 + 6 = 10 true The point (4, 2) checks, so it is the solution of the system.
Problem from today’s homework: (try this one in your notebook) • Solution: • Graph the 2 lines. • They appear to intersect at (3,3) • Now check x = 3, y = 3 back into BOTH equations to make sure they both give true statements.
Example y (3,3) (0, 2) (3, 0) x (0, -1) Solve the following system of equations by graphing. -x + 3y = 6 and 3x – 9y = 9 • First, graph -x + 3y= 6. • Solving for y gives y = 1/3x + 2. • Plot the y-intercept of 2, then use the slope of 1/3 to go up one, over three. • Next, graph 3x- 9y = 9. • Solving for y gives y = 1/3x - 1. • Plot the y-intercept of -1, then use the slope of 1/3 to go up one, over three. The lines APPEAR to be parallel.
Example (cont.) • Both lines have a slope of ; since they have different y-intercepts they are parallel and do not intersect. Hence, there is no solution to the system. • Although the lines appear to be parallel, you still need to check that they have the same slope. You can do this by solving both equations for y, as we did on the previous slide.
Example y (5, 2) (-1, 0) (2, 1) x (-4, -1) (7, -2) Solve the following system of equations by graphing. x = 3y – 1 and 2x – 6y = -2 First, graph x = 3y – 1. Second, graph 2x – 6y = -2. The lines APPEAR to be identical.
Example (cont.) y = x + (divide both sides by 3) y = x + (divide both sides by -6) • Although the lines appear to be identical, you still need to check that they are identical equations. You can do this by solving for y. First equation, x = 3y – 1 3y = x + 1 (add 1 to both sides) Second equation, 2x – 6y = -2 -6y = -2x – 2 (subtract 2x from both sides) • The two equations are identical, so the graphs must be identical. There are an infinite number of solutions to the system (all the points on the line y = 1/3 x + 1/3).
REMINDER:At the next class, you will get your graded Worksheet 2 back, and you’ll have a quiz on those graphs at the end of the class session. HW 4.1 on today’s material is due at the start of the next class session. That material will be covered on the quiz two class sessions from today, along with material from HW 4.2. Lab hours: Mondays through Thursdays 8:00 a.m. to 7:30 p.m.
You will have 12 minutes to complete this quiz. • No notes allowed (including graded worksheet.) • The answer sheet has: • a table for your x-y values (minimum of eight ordered pairs) • a graph grid for plotting the points • spaces for writing the x- and y-intercepts (write as ordered pairs, or write NONE if there is no intercept) • spaces for writing the domain and range in interval notation • a table of square roots in case you need them for your graph • a spare graph grid in case you make a mistake on the first one and don’t want to erase. Please open your laptops, log in to the MyMathLab course web site, and open Quiz 8.2 Worksheet 1.