Download
1 / 32
320 likes | 596 Views
POPULATION BIOLOGY POPULATION DYNAMICS CHAPTER 4.1: Objectives:. Compare and contrast exponential and linear population growth. Relate the reproductive patterns of different populations of organisms to models of population growth.

E N D
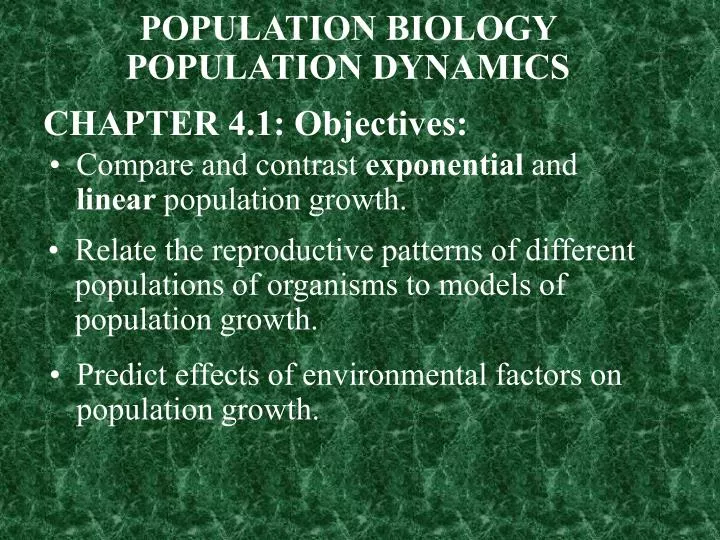
POPULATION BIOLOGY POPULATION DYNAMICS CHAPTER 4.1: Objectives: • Compare and contrast exponential and linear population growth. • Relate the reproductive patterns of different populations of organisms to models of population growth. • Predict effects of environmental factors on population growth.
A _______ is a group of organisms, all of the same species, that live in a specific area. • A healthy population will grow and die at a steady rate unless it runs out of ____ or ______, or is _______ in some way by disease or predators. • Scientists study changes in populations in a variety of ways.
One method involves introducing organisms into an environment that contains abundant resources and then watching how the organisms react.
Studies of populations of larger organisms, such as an elk population in a national park, require methods such as the use of ____ monitors. • The growth of populations is unlike the growth of pay you get from a job. Populations of organisms, do not experience _____ growth. The graph of a growing population starts out slowly, then begins to resemble a __-shaped curve.
Population Growth of Houseflies 1 million 500,000 Population size 100 One year
The initial increase in the number of organisms is slow because the number of reproducing individuals is ______. • Soon, however, the rate of population growth increases because the total number of individuals that are able to reproduce has increased. • A J-shaped growth curve illustrates ________ population growth. • Exponential growth means that as a population gets larger, it also grows at a _____ rate. • Exponential growth results in unchecked ______.
________ factors, such as availability of food, disease, predators, or lack of space, will cause population growth to slow. • Under these pressures, the population may stabilize in an __-shaped growth curve.
The number of organisms of one species that an environment can support indefinitely is its ______ capacity. • When a population overshoots the carrying capacity, then _______ factors may come into effect.
_______ begin to exceed _____ and the population falls below carrying capacity. Carrying capacity
In _____, animal and plant populations change in size. • Biologists study the factor that determines population growth—an organism’s reproductive pattern, also called its ____-history pattern. • A variety of population growth patterns are possible in nature.
______ life-history patterns are common among organisms from changeable or unpredictable environments. • Rapid life-history organisms have a _____ body size, mature rapidly, reproduce early, and have a ____ life span.
Large species that live in more stable environments usually have ____ life-history patterns.
Slow life-history organisms reproduce and mature slowly, and are ____-lived. They maintain population sizes at or near carrying capacity.
How organisms are _______ can be important. • Three patterns of dispersal are random, clumped, and uniform. Random Clumped Uniform
Ecologists have identified two kinds of limiting factors that are related to dispersal: density-_______ and density-_______ factors. • Population density describes the ______ of individuals in a given area. • Density-dependent factors include ______, competition, predators, parasites, and food. • Disease, for example, can spread more quickly in a population with members that live _____ together.
Density-independent factors can affect all populations, regardless of their density. • Most density-independent factors are ______ factors, such as temperature, storms, floods, drought, and major habitat disruption.
Population sizes are limited not only by abiotic factors, but also are controlled by various __________ among organisms that share a community.
When a _______ consumes ____ on a large enough scale, it can have a drastic effect on the size of the prey population. • Populations of predators and their prey are known to experience cycles or changes in their numbers over periods of time.
The data in this graph reflect the number of hare and lynx pelts sold to the Hudson’s Bay Company in northern Canada from 1845 through 1935. Lynx and Hare Pelts Sold to the Hudson’s Bay Company Lynx Hare Number of organisms(in thousands) Times (in years)
In field studies, _________ increases the chance that resources will be available for the remaining individuals in a prey population.
__________is a density-dependent factor. • When only a few individuals compete for resources, no problem arises. • When a population increases to the point at which demand for resources exceeds the supply, the population size decreases. • When populations of certain organisms become crowded, individuals may exhibit symptoms of _____. • As populations increase in size in environments that cannot support increased numbers, individual animals can exhibit a variety of stress symptoms.
These include ________, decrease in parental care, decreased fertility, and decreased ________ to disease. • They become _______ factors for growth and keep populations below carrying capacity.
HUMAN POPULATION CHAPTER 4.2: Objectives • Identify how the birthrate and death rate affect the rate at which a population changes. • Compare the age structure of rapidly growing, slow-growing, and no-growth countries. • Explain the relationship between a population and the environment.
In the United States, a census is taken every ___ years. • One of the most useful pieces of data is the rate at which each country’s population is _______ or declining. • These figures are the basis for _________, the study of human population size, density and distribution, movement, and its birth and death rates.
Human population growth is different because humans have the ability to change their ______________. • People live longer and are able to produce offspring that live long enough to produce offspring, hence, a population grows. • There are a number of factors that determine population growth rate. • These are _______, deaths, ___________ and emigration. • _________ is the number of live births per 1000 population in a given year.
______ rate is the number of deaths per 1000 population in a given year. • Movement of individuals into a population is ____________. Movement out of a population is ______________. • Birthrate – Death rate = Population Growth Rate (PGR) If the birth rate of a population equals its death rate, then the population growth rate is _____.
If the PGR is above zero, more new individuals are entering the population than are leaving, so the population is _______. • A PGR can also be less than zero. • Another quantitative factor that demographers look at is the _______ time of a population. • Doubling time is the time needed for a population to double in size. • The time it takes for a population to double varies depending on the current population and growth rate.
Doubling time can be calculated for the world, a country, or even a small region, such as a city.
Population Distribution Per Age Range for Several Countries Slow growth Stable growth Rapid growth Reproductive years Male Female Age Population (percent of total for each country)
The needs of populations differ greatly throughout the world. • Sometimes, a population grows more rapidly than the available resources can handle.
Resources that are needed for life, such as food and water, become scarce or _______________.
The amount of ____ produced by a population becomes difficult to dispose of properly. • These conditions can lead to stress on current resources and contribute to the spread of _____ that affect the stability of human populations both now and to come.