Download
1 / 1
10 likes | 130 Views
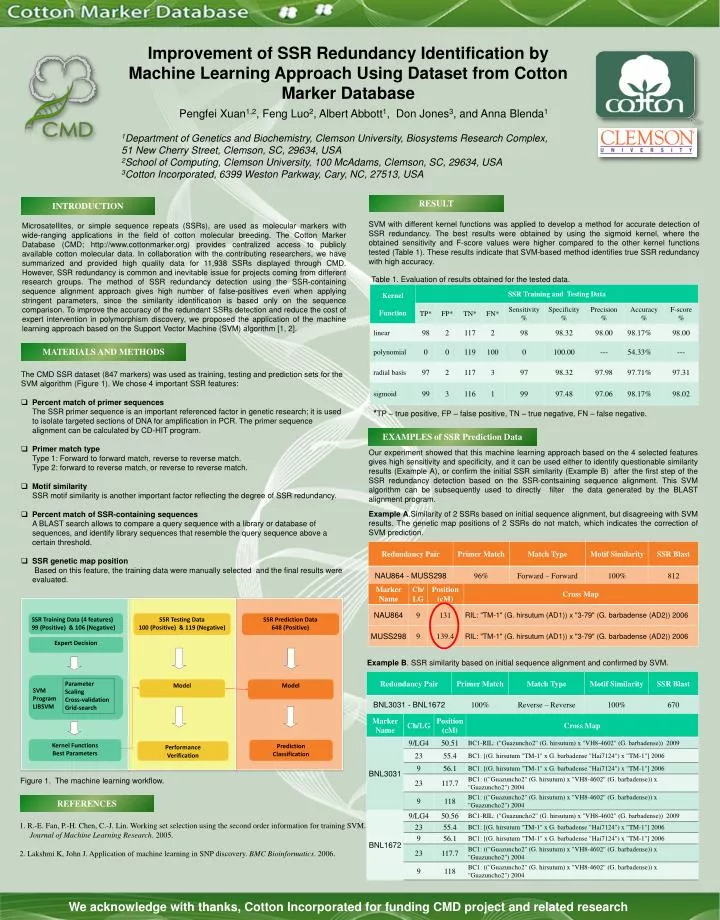
SSR Training Data ( 4 features) 99 ( Positive) & 106 ( Negative) . SSR Testing Data 100 ( Positive) & 119 ( Negative). SSR Prediction Data 648 ( Positive).

E N D
SSR Training Data (4 features)99 (Positive) & 106 (Negative) SSR Testing Data 100 (Positive) & 119 (Negative) SSR Prediction Data 648 (Positive) Improvement of SSR Redundancy Identification by Machine Learning Approach Using Dataset from Cotton Marker Database Pengfei Xuan1,2, Feng Luo2, Albert Abbott1, Don Jones3, and Anna Blenda1 1Department of Genetics and Biochemistry, Clemson University, Biosystems Research Complex, 51 New Cherry Street, Clemson, SC, 29634, USA 2School of Computing, Clemson University, 100 McAdams, Clemson, SC, 29634, USA 3Cotton Incorporated, 6399 Weston Parkway, Cary, NC, 27513, USA Expert Decision SVM ProgramLIBSVM Parameter ScalingCross-validation Grid-search Model Model Kernel Functions Best Parameters Prediction Classification Performance Verification RESULT INTRODUCTION SVM with different kernel functions was applied to develop a method for accurate detection of SSR redundancy. The best results were obtained by using the sigmoid kernel, where the obtained sensitivity and F-score values were higher compared to the other kernel functions tested (Table 1). These results indicate that SVM-based method identifies true SSR redundancy with high accuracy. Microsatellites, or simple sequence repeats (SSRs), are used as molecular markers with wide-ranging applications in the field of cotton molecular breeding. The Cotton Marker Database (CMD; http://www.cottonmarker.org) provides centralized access to publicly available cotton molecular data. In collaboration with the contributing researchers, we have summarized and provided high quality data for 11,938 SSRs displayed through CMD. However, SSR redundancy is common and inevitable issue for projects coming from different research groups. The method of SSR redundancy detection using the SSR-containing sequence alignment approach gives high number of false-positives even when applying stringent parameters, since the similarity identification is based only on the sequence comparison. To improve the accuracy of the redundant SSRs detection and reduce the cost of expert intervention in polymorphism discovery, we proposed the application of the machine learning approach based on the Support Vector Machine (SVM) algorithm [1, 2]. Table 1. Evaluation of results obtained for the tested data. MATERIALS AND METHODS • The CMD SSR dataset (847 markers) was used as training, testing and prediction sets for the SVM algorithm (Figure 1). We chose 4 important SSR features: • Percent match of primer sequencesThe SSR primer sequence is an important referenced factor in genetic research; it is used to isolate targeted sections of DNA for amplification in PCR. The primer sequence alignment can be calculated by CD-HIT program. • Primer match type Type 1: Forward to forward match, reverse to reverse match. Type 2: forward to reverse match, or reverse to reverse match. • Motif similaritySSR motif similarity is another important factor reflecting the degree of SSR redundancy. • Percent match of SSR-containing sequencesA BLAST search allows to compare a query sequence with a library or database of sequences, and identify library sequences that resemble the query sequence above a certain threshold. • SSR genetic map position Based on this feature, the training data were manually selected and the final results were evaluated. *TP – true positive, FP – false positive, TN – true negative, FN – false negative. EXAMPLES of SSR Prediction Data Our experiment showed that this machine learning approach based on the 4 selected features gives high sensitivity and specificity, and it can be used either to identify questionable similarity results (Example A), or confirm the initial SSR similarity (Example B) after the first step of the SSR redundancy detection based on the SSR-contsaining sequence alignment. This SVM algorithm can be subsequently used to directly filter the data generated by the BLAST alignment program. Example A.Similarity of 2 SSRs based on initial sequence alignment, but disagreeing with SVM results. The genetic map positions of 2 SSRs do not match, which indicates the correction of SVM prediction. Example B. SSR similarity based on initial sequence alignment and confirmed by SVM. Figure 1. The machine learning workflow. DISCUSSION REFERENCES 1. R.-E. Fan, P.-H. Chen, C.-J. Lin. Working set selection using the second order information for training SVM. Journal of Machine Learning Research. 2005. 2. Lakshmi K, John J. Application of machine learning in SNP discovery. BMC Bioinformatics. 2006. We acknowledge with thanks, Cotton Incorporated for funding CMD project and related research