Download

1 / 32
320 likes | 413 Views
Limiting Fragmentation Observations at . Richard S Hollis University of Illinois at Chicago For the Collaboration. Collaboration (April 2004). Birger Back, Mark Baker, Maarten Ballintijn, Donald Barton, Russell Betts, Abigail Bickley,

E N D
Limiting Fragmentation Observations at Richard S Hollis University of Illinois at Chicago For the Collaboration
Collaboration (April 2004) Birger Back,Mark Baker, Maarten Ballintijn, Donald Barton, Russell Betts, AbigailBickley, Richard Bindel, Wit Busza (Spokesperson), Alan Carroll, Zhengwei Chai, Patrick Decowski, Edmundo García, Tomasz Gburek, Nigel George, Kristjan Gulbrandsen, Clive Halliwell, Joshua Hamblen, Adam Harrington, Michael Hauer, Conor Henderson, David Hofman, Richard Hollis, Roman Hołyński, Burt Holzman, Aneta Iordanova, Jay Kane, Nazim Khan, Piotr Kulinich, ChiaMingKuo, Willis Lin, Steven Manly, Alice Mignerey, Gerrit van Nieuwenhuizen, Rachid Nouicer, Andrzej Olszewski, Robert Pak, Inkyu Park, Heinz Pernegger, Corey Reed, Christof Roland, Gunther Roland, Joe Sagerer, Helen Seals, Iouri Sedykh, Wojtek Skulski, Chadd Smith, Maciej Stankiewicz, Peter Steinberg, George Stephans, Andrei Sukhanov, Marguerite Belt Tonjes, Adam Trzupek, CarlaVale, Sergei Vaurynovich, Robin Verdier, Gábor Veres, Peter Walters, Edward Wenger, Frank Wolfs, Barbara Wosiek, Krzysztof Woźniak, Alan Wuosmaa, Bolek Wysłouch ARGONNE NATIONAL LABORATORY BROOKHAVEN NATIONAL LABORATORY INSTITUTE OF NUCLEAR PHYSICS PAN, KRAKOW MASSACHUSETTS INSTITUTE OF TECHNOLOGY NATIONAL CENTRAL UNIVERSITY, TAIWAN UNIVERSITY OF ILLINOIS AT CHICAGO UNIVERSITY OF MARYLAND UNIVERSITY OF ROCHESTER
Outline • PHOBOS • Detector • Multiplicity Measurement Technique • Multiplicity measurements • Au+Au • p+p • d+Au • Flow measurements
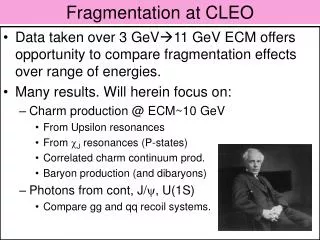
Limiting Fragmentation • Term for particles produced at high η. • Particles produced close to the beam rapidity of one of the colliding nuclei • Same “Limiting” distribution of charged-particles in this region independent of energy Center-of-mass System
Rapidity and Pseudorapidity • |y|<2 • significant deviation between y and η • |y|>2 • Shape is similar • η distribution is wider • Approximation y ≈ η • y shifts under a longitudinal boost • dN/dy is not distorted • Shift to target rest frame by ybeam • For both η and y
Limiting Fragmentation Target rest frame • Expected → a narrow Fragmentation Region • Observed → “Extensive Longitudinal Scaling”
ToF Multiplicity Array Octagon Rings Spectrometer Trigger Counters Paddles T0 and Cerenkovs Detector
Multiplicity Detectors • Octagon: • Mid-rapidity (|η| < 3.2) • Rings: • Forward detectors (3.0 < |η| < 5.4)
Multiplicity Array Single Event Rings Octagon Rings
Hit Counting Basic Count digital hit pads Hit density correction Count digital unoccupied pad Assume Poisson statistics Determine mean occupancy → Apply correction Occupancy corrections derived from data Analogue Correction Applied Energy deposition spectra A fit to this determines the relative multi-hit contribution Multiplicity Reconstruction
Au+Au dNch/dη vs η • Multiplicity • Almost all Phase space covered • 3 energies • √s = 19.6 to 200 GeV • Large range of collision geometries Total Number of Charged Particles Data from PRL 91 052303 (2003)
ybeam 200 Au+Au dNch/dη vs η • Scaling by Npart/2 • Distributions are relatively the same • <Npart> is almost the same for each energy • ybeam grows with energy • Shift each η by ybeam Total Number of Charged Particles divided by half Npart
Au+Au dNch/dη vs η–ybeam • Region of ‘overlap’ • For each energy • Close to rapidity of one projectile • Expected • Narrow fragmentation region • Observed • Extensive longitudinal scaling • Fragmentation Region • Grows with energy 200GeV 130GeV 19.6GeV
Au+Au dNch/dη vs η–ybeam • Region of overlap • Also covered by an overlap in detector- space • -1<η-ybeam<0 • Covered by Rings for 200GeV • Covered by Octagon for 19.6GeV • This is not a ‘detector’ effect!! 200GeV 130GeV 19.6GeV
Centrality Dependence • Centrality • Data divided into distinct multiplicity bins • Central 0-6% • Npart ~ 340 • Peripheral 25-35% • Npart ~ 140 • Not too peripheral • Restricted by the 19.6GeV data 200GeV 130GeV 19.6GeV
Centrality + Energy Dependence • Observations • Reduction at η~0 • Increase at η-ybeam>0 • Important observation for the total yield • Measure the yield at η ≈ 0 for 200GeV • Central/Peripheral≈1.1 200GeV 130GeV 19.6GeV
Departure Point fromLimiting Curve 200GeV 130GeV 19.6GeV 200GeV 130GeV 19.6GeV Scale Peripheral by x1.1 Same ‘relative’ departure point
Centrality dependenceat 200GeV • Evolution from Central to peripheral • Slope decreases • Can measure slope • From η-ybeam~-2 and 0 • For each centrality • Parameterize p+p • extract the slope UA5 data from Z.Phys.C 43 (1989) 1
Centrality dependence of the slope • As expected • Slope trend declines • Systematically higher than p+p • A more peripheral measurement is needed
Slope and Midrapidity yield • As expected • Slope trend declines • Systematically higher than p+p • Same trend seen at midrapidity • Total yields ‘flat’ • For increasing centrality • Midrapidity rise • Decrease for η-ybeam>0 • Effects cancel each other Midrapidity yield / pp Limiting Fragmentation Slope / pp pp
Slope and Total charged-particles • As expected • Slope trend declines • Systematically higher than p+p • Same trend seen at midrapidity • Total yields ‘flat’ • For increasing centrality • Midrapidity rise • Decrease for η-ybeam>0 • Effects cancel each other Total Charged-Particles / pp Limiting Fragmentation Slope / pp pp
Slope and Midrapidity yield • Same trend seen at midrapidity • Not Surprising • dN/dη ~ trapezoid • Midrapidity α slope Midrapidity yield / pp Limiting Fragmentation Slope / pp pp
Smaller systems • This measurement is not peculiar to Au+Au • First observed in p+p • Also in d+Au • All exhibit the similar features
p+p • Collection of many data over a factor of ~50 in √s • Reasonable Limiting Fragmentation agreement! • η’ = η-ybeam UA5 (200-900) → Z.Phys.C 43 (1989) 1 ISR (23.6,45.2) → Nucl.Phys B129 365 (1977)
d+Au 50-70% Centrality, PHOBOS data d+Au data from nucl-ex/0409021 p+Em referenced therein
d+Au • Limiting fragmentation in both • Projectile rest frame • Target rest frame • Centrality dependence • Systematic comparison with lower energy data • No need to change species • All measured in same collision system • Limiting fragmentation in each centrality bin
Elliptic Flow • The effect of the geometrical asymmetry • Non-central collisions • Procedure • Measure the angle for the highest yield (ΨR) • Relative to the detector • “Reaction Plane” • Measure all particles relative to this angle • 2V2cos (2(f-YR) YR dN/d(f -YR ) = N0 (1 + 2V1cos (f-YR) + 2V2cos (2(f-YR) + ... )
Flow Results • Elliptic flow results • Statistical errors only • Shift by ybeam again Data from nucl-ex/0406021
Flow Results • Elliptic flow results • Statistical errors only • Shift by ybeam again • Fold and average signals Data from nucl-ex/0406021
Outlook • Several questions remain • Centrality dependence for whole range • Collision species dependence • Will Cu+Cu fit into Au+Au data? • Is this observation specific to η? • Original hypothesis was for rapidity distributions • Does each particle species exhibit the same features? • PHOBOS cannot identify particles away from midrapidity
Particle Species • Lots of data available • Pions, Protons • Large rapidity and energy coverage Brahms (200) → PRL 91 072305 (2003) (protons) arXiv:nucl-ex/0403050 (mesons) E895 (others) → PR C66 054905 (2003)
Summary • PHOBOS has measured multiplicity and flow at high-η. • Large systematic dataset • -5.4<η<5.4 • 2 to 360 participants • √s = 19.6 to 200 GeV • In the target rest frame • Multiplicity exhibits a common yield curve close to the beam rapidity of one nucleus • Extensive longitudinal scaling observed in • Au+Au, d+Au and p+p • Flow exhibits similar type behavior