Download
1 / 20
210 likes | 427 Views
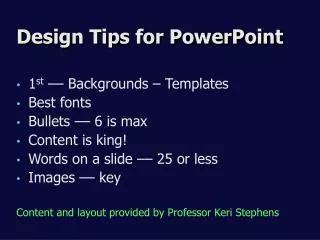
Design Tips for Effective PowerPoint Use. Presented by : Susan Dobbs Krissy Malone Sue Sikora CAT 520 Fall 2005. FONTS (TYPEFACES). Legibility and Clarity — Use Sans Serif fonts for titles or headings Readability — May use Serif or San Serif fonts for text

E N D
Design Tips for Effective PowerPoint Use Presented by: Susan Dobbs Krissy Malone Sue Sikora CAT 520 Fall 2005
FONTS (TYPEFACES) • Legibility and Clarity — UseSans Seriffonts fortitles or headings • Readability— May use Serif or San Serif fonts for text Examples of each on next slide
Font Size & 7 Rule • Titles – at least 36 pt • Text – at least 24 pt • No more than 7 lines on a slide (including the title) Examples of each on next slide
Shape • Simple Shapes – effective, functional, and versatile • Common Shapes – provide direction, organize and unify, and make connections • Complex Shapes – realistic images Examples of each on next slide
Simple Shapes - Circles, rectangles, etc. Common Shapes – Arrows, triangles, stars, etc. Complex Shapes – Clip Art and digital images
Color • Used for separating information, showing quantity, representing reality, decorating • Edit color schemes & font colors for effective use of color
Depth • Used to show size, dimension, texture; important to good figure/ground • Use tabs under “Fill Effects” to create various backgrounds for slides
Space • Usually ignored; the element between the visual elements; creates balance & symmetry • Use “Slide Layout” to design balanced slides in presentations
Alignment • Lining things up along an imaginary path • Left, right, top, bottom, centered, & shape are kinds • Each can convey a different message
Repetition, Repetition, Repetition • Using an element of a visual over again to create sense of harmony & unity • Colors, shape, fonts, & patterns can be repeated to effectively convey information Consistent Font Consistent Color Consistent Layout
P R O X I M I T Y • How close elements are to each other • Shows relationships between elements • Closer together = closely related info. • Farther apart = unrelated info.
Figure/Ground • Enhance figure/ ground distinctions using contrast. • This slide looks washed out. Important data is not emphasized. • Increasing contrast made the important information in this slide easier to distinguish.
Tables • What do I want emphasized? • In this table, data is distracted by the “data container” of the chart. • Make the data stand out.
Hierarchy • Deals with communicating relative importance between elements in a display • Cluster information into related groups (chunking)
Hierarchy • Use tools to create levels of importance • A navigational structure can help learners keep track of where they are at in the total presentation.
Bottom Line Combining all of these elements Equals Good Gestalt
References • Lohr, L.L., (2003). Creating Graphics for Learning and Performance: Lessons in Visual Literacy. Upper Saddle River, New Jersey: Merrill Prentice Hall.