Download
1 / 18
180 likes | 192 Views
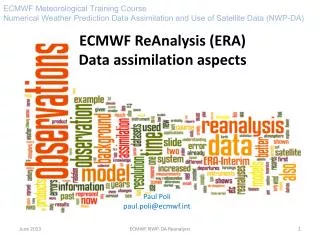
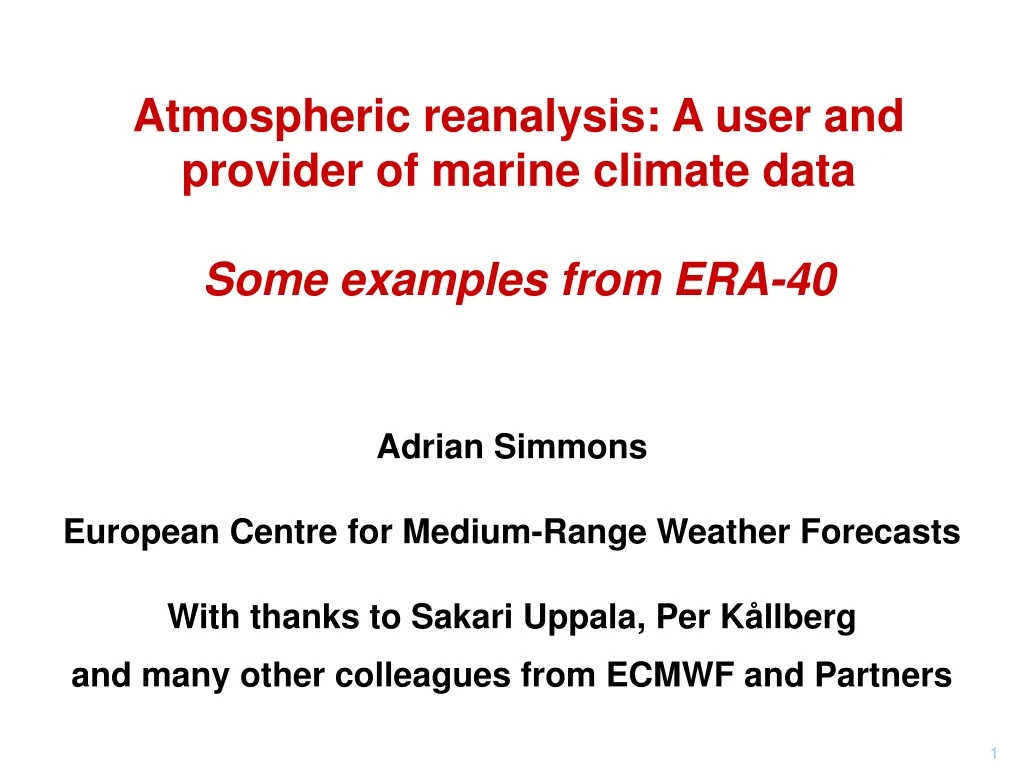
Atmospheric reanalysis: A user and provider of marine climate data Some examples from ERA-40. Adrian Simmons European Centre for Medium-Range Weather Forecasts With thanks to Sakari Uppala, Per K ållberg and many other colleagues from ECMWF and Partners. ERA-40.

E N D
Atmospheric reanalysis: A user and provider of marine climate dataSome examples from ERA-40 Adrian Simmons European Centre for Medium-Range Weather Forecasts With thanks to Sakari Uppala, Per Kållberg and many other colleagues from ECMWF and Partners
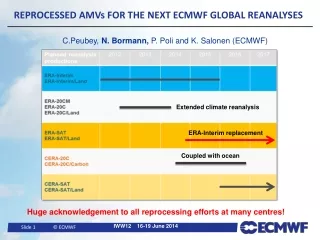
ERA-40 • A re-analysis of observations from September 1957 to August 2002, produced by ECMWF with considerable help from Partner Institutions • Production was completed in April 2003; tidying up is close to completion • Marine climate data used by ERA-40: • Meteorological and wave observations (COADS, buoys, …) • SST and sea-ice analyses (Rayner, Reynolds,…) • Experimentation aimed at improved future reanalysis is addressing main problem areas for ERA-40
SHIP coverage Sept 1957 106997 reports Aug 2002 181981 reports
Radiosonde coverage 1958 Average number of soundings per day: 1609 2001 Average number of soundings per day: 1189
SYNOPS AND SHIPS BUOYS RADIOSONDES PILOTS AND PROFILERS AIRCRAFT IR AND MW SOUNDERS SATELLITE WINDS WATER-VAPOUR RADIANCES SSM/I SCATTEROMETER OZONE Data coverage 09UTC – 15UTC 5 June 2004
SHIP winds used at anemometer height where known Island SYNOP winds suppressed Mean differences in 10m wind speed for January 1989 between ERA-40 and ERA-15 Contour interval 0.5ms-1 Yellow/red indicates ERA-40 windier than ERA-15
DRIBU winds have been used at the actual anemometer height only since 25 August 2005 in ECMWF operations 00UTC 3 May 2005 Red: Rejected Green: Accepted by analysis Courtesy: J. Bidlot
DRIBU winds have been used at the actual anemometer height only since 25 August 2005 in ECMWF operations Wind speed bias(ms-1) (Model – Obs) May 2005 Control Adjusted Courtesy: J. Bidlot
Inadequate ERA-40 data coverage Erroneous station climate data Identification of data problems: a land example Surface air temperature anomaly (oC) with respect to 1987-2001 Europe ERA-40 – CRUTEM2v
Based on monthly station data (Jones and Moberg, 2003) Based on monthly station data (Jones and Moberg, 2003) Based on ERA-40 reanalysis of synoptic data Based on simulation using ERA-40 model and SST/sea-ice Comparison of reanalysis and land-station values Surface air temperature anomaly (oC) with respect to 1987-2001 Northern hemisphere
RSS MSU-2 ERA-40 MSU-2 equivalent (Santer et al., 2004) Linear trends 1979-2001 (OC/decade) ERA-40 SST ERA-40 2m T
ERA-40 1 Jan to 31 Dec 2000 GPCP Excessive precipitation over the tropical oceans • A battle between a dry-biased model and satellite data in rain-free areas, exacerbated by: • spreading of moistening analysis increments to rainy areas • data biases, especially due to volcanic aerosols • feedbacks
ERA-40 Reduced precipitation over the tropical oceans1 Jan to 31 Dec 2000 Rerun • Improvement due to: • better bias correction of satellite data • new control variable for humidity analyses • suppression of moistening analysis increments where convection already strong GPCP
6h 3D-Var 12h 4D-Var 6h 4D-Var 12h 4D-Var (bc) ERA-40 6h 3D-Var 12h 4D-Var 6h 4D-Var 12h 4D-Var (bc) ERA-40 Forecast range (hours) Better global balance Forecast range (hours)
Reduced precipitation over the tropical oceans August 1999 to December 2000 Precipitation mm/day Total column water vapour kg/m2
1971 - 2000 90th percentile of significant wave height February m Global wave climatology atlas S. Caires, A. Sterl, G. Komen and V. Swail http://www.knmi.nl/onderzk/oceano/waves/era40
Ocean-model forcing Correlation (%) with independent altimeter measurements from 1993 to 2001 for tropical oceans Courtesy: M. Alonso Balmaseda
Plans for reanalysis ECMWF • An interim reanalysis • will cover 1989-2009(?) starting late this year or early next • will use 4D-Var and latest version of forecasting system • Preparation for a new global (and regional?) reanalysis • Production of the new global reanalysis • ERA-70(?), to begin in 2009 or 2010 Japan Meteorological Agency • JCDAS (JMA CDAS) • JRA-25 (1979-2004) will be continued in near real time • 2nd Japanese reanalysis (JRA-50) • will cover 1958-2010 and be completed by 2012