Download
1 / 13
130 likes | 134 Views
This figure presents the number of organ donors, donors per million of population, donors per thousand deaths, mean age of donors, gender of donors, cause of donor death, trend to multiple organ retrieval, and organ recipients transplanted per donor.

E N D
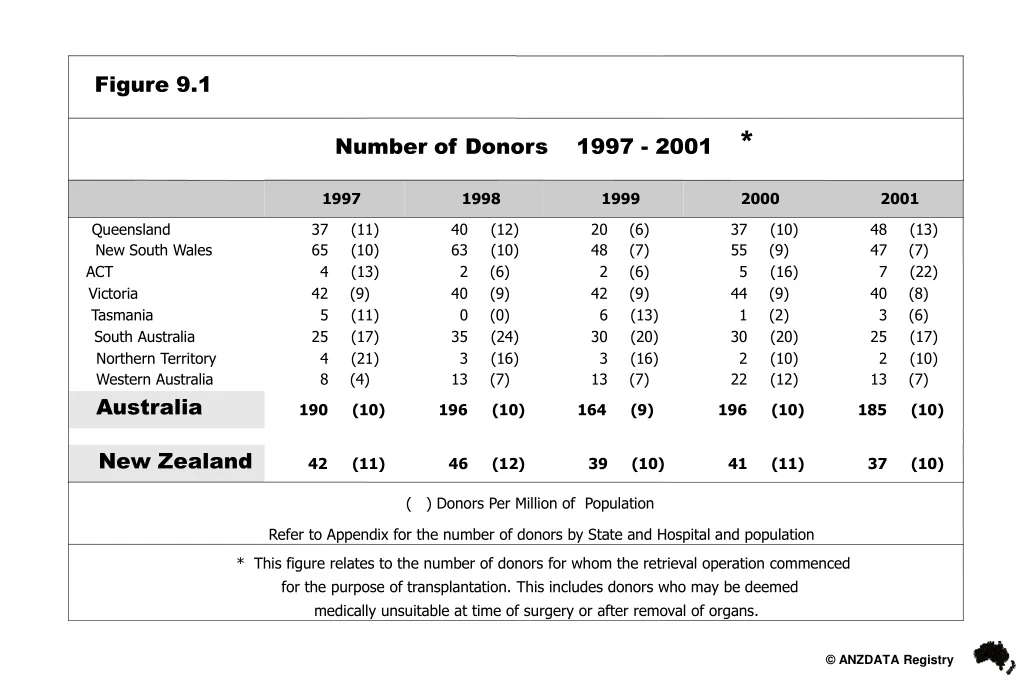
Figure 9.1 * Number of Donors 1997 - 2001 1997 1998 1999 2000 2001 Queensland 37 (11) 40 (12) 20 (6) 37 (10) 48 (13) New South Wales 65 (10) 63 (10) 48 (7) 55 (9) 47 (7) ACT 4 (13) 2 (6) 2 (6) 5 (16) 7 (22) Victoria 42 (9) 40 (9) 42 (9) 44 (9) 40 (8) Tasmania 5 (11) 0 (0) 6 (13) 1 (2) 3 (6) South Australia 25 (17) 35 (24) 30 (20) 30 (20) 25 (17) Northern Territory 4 (21) 3 (16) 3 (16) 2 (10) 2 (10) Western Australia 8 (4) 13 (7) 13 (7) 22 (12) 13 (7) Australia 190 (10) 196 (10) 164 (9) 196 (10) 185 (10) New Zealand 42 (11) 46 (12) 39 (10) 41 (11) 37 (10) ( ) Donors Per Million of Population Refer to Appendix for the number of donors by State and Hospital and population * This figure relates to the number of donors for whom the retrieval operation commenced for the purpose of transplantation. This includes donors who may be deemed medically unsuitable at time of surgery or after removal of organs.
Figure 9.2 Donors per Thousand Deaths 1996 - 2001 Aust. N.Z. Year Qld NSW ACT Vic. Tas. SA NT WA 1996 1.6 1.5 4.8 1.5 0.3 2.2 3.9 1.1 1.5 1.3 1997 1.7 1.5 3.0 1.3 1.3 2.2 4.5 0.7 1.5 1.5 1998 1.8 1.4 1.6 1.2 0.0 3.0 3.6 1.2 1.5 1.8 1999 0.9 1.0 1.5 1.3 1.6 2.7 3.5 1.2 1.3 1.4 2000 1.7 1.2 3.9 1.4 0.3 2.5 2.2 2.1 1.5 1.5 2001 - - - - - - - - - 1.3
Figure 9.3 Australian States Mean Age of Donors 1997 - 2001 Aust. Qld NSW ACT Vic. Tas. SA NT WA 1997 37.5 39.6 48.3 43.8 38.3 45.3 33.5 28.7 40.4 1998 35.7 42.7 42.1 43.4 - 40.3 44.7 33.9 40.4 1999 40.0 42.4 49.9 40.1 35.8 35.4 24.3 36.5 39.3 2000 40.3 40.5 30.3 45.1 63.1 39.0 44.3 39.7 41.1 2001 40.3 40.8 35.1 41.4 30.8 43.0 33.4 31.5 40.0
Figure 9.4 Gender of Donors 1989 - 2001 Female Male Total Queensland 178 (34%) 342 (66%) 520 New South Wales 347 (41%) 495 (59%) 842 ACT 18 (34%) 35 (66%) 53 Victoria 250 (44%) 320 (56%) 570 Tasmania 12 (29%) 30 (71%) 42 South Australia 132 (41%) 188 (59%) 320 Northern Territory 3 (11%) 24 (89%) 27 Western Australia 85 (43%) 113 (57%) 198 Australia 1025 (40%) 1547 (60%) 2572 New Zealand 150 (43%) 195 (57%) 345 1993-2001
Cause of Donor Death Australia 1989 - 2001 n=2572
Cause of Donor Death New Zealand 1993 - 2001 n=345
Figure 9.6 Cause of Donor Death Related to Age Group 2001 Australia New Zealand 0-14 15-34 35-54 55 on Total 0-14 15-34 35-54 55 on Total CVA 4 12 43 36 95 0 2 12 8 22 Trauma (road) 5 31 5 0 41 0 5 4 0 9 Trauma (non-road) 2 5 5 2 14 0 3 0 1 4 Other 5 11 18 1 35 0 2 0 0 2 Total 16 59 71 39 185 0 12 16 9 37
Figure 9.7 Cause of Donor Death 2001 Australia New Zealand Causes of Death Male Female Total Male Female Total Cerebral Infarct 9 6 15 2 1 3 CVA Intracranial Haemorrhage 49 31 80 6 13 19 Cyclist 2 0 2 0 0 0 Motor Bike Accident 6 0 6 1 0 1 Road Motor Vehicle Accident 13 7 20 6 1 7 Trauma Pedestrian 8 2 10 0 1 1 Other Road Accident 3 0 3 0 0 0 Fall 6 1 7 1 1 2 Other Felony / Crime - Assault 1 0 1 1 0 1 Gunshot 4 0 4 1 0 1 Trauma Other Trauma 1 1 2 0 0 0 Airway Obstruction 1 0 1 0 0 0 Asphyxiation 2 0 2 0 0 0 Asthma 1 2 3 0 0 0 Carbon Monoxide 0 1 1 0 0 0 Cardiac Arrest 5 6 11 0 0 0 Hypoxia Cyanide Poisoning 1 0 1 0 0 0 Hanging 2 0 2 0 0 0 Anoxia Seizure 1 0 1 0 0 0 Smoke Inhalation 1 0 1 0 0 0 Pulmonary Embolism 0 1 1 0 0 0 Thoracic Aortic Aneurysm 1 0 1 0 0 0 Ventricular Fibrillation 0 1 1 0 0 0 Carotid Artery Dissection 0 1 1 0 0 0 Cerebral Arteritis 0 1 1 0 0 0 Cerebral Oedema 1 3 4 0 0 0 Other Meningitis (Meningococcal) 0 1 1 1 0 1 Meningitis (Strep.pneumoniae) 0 1 1 0 0 0 Meningitis (Viral) 0 0 0 0 1 1 Water Intoxication 1 0 1 0 0 0 Total 119 66 185 19 18 37
Figure 9.8 Trend to Multiple Organ Retrieval 1997 - 2001 Australia New Zealand No. of Organs 1997 1998 1999 2000 2001 1997 1998 1999 2000 2001 Single 24% 23% 17% 21% 19% 33% 20% 21% 7% 19% Two 23% 32% 30% 29% 32% 31% 50% 44% 42% 31% Three 23% 19% 27% 24% 21% 33% 16% 23% 34% 22% Four 24% 20% 23% 20% 19% 3% 12% 10% 15% 25% Five 6% 6% 3% 6% 9% 0% 2% 2% 2% 3%
Figure 9.9 State by State Comparison of Multiple Organ Retrieval 2001 No. of Aust. N.Z. Qld NSW ACT Vic. Tas. SA NT WA Organs Single 7 (15%) 14 (30%) 0 (0%) 8 (20%) 1 (33%) 4 (18%) 0 (0%) 0 (0%) 34 (19%) 7 (19%) Two 18 (39%) 12 (26%) 3 (43%) 6 (15%) 0 (0%) 11 (50%) 1 (50%) 4 (31%) 57 (32%) 11 (31%) Three 8 (17%) 11 (23%) 2 (29%) 11 (28%) 0 (0%) 2 (9%) 1 (50%) 5 (38%) 38 (21%) 8 (22%) Four 11 (24%) 5 (10.5%) 1 (14%) 9 (22%) 1 (33%) 4 (18%) 0 (0%) 3 (23%) 34 (19%) 9 (25%) Five 2 (5%) 5 (10.5%) 1 (14%) 6 (15%) 1 (33%) 1 (5%) 0 (0%) 1 (8%) 17 (9%) 1 (3%) Total 46 47 7 40 3 22 2 13 180 36 NB: 2 kidneys = 1 organ, 2 lungs = 1 organ On occasions when only one kidney is retrieved, this is also defined as one organ.
Figure 9.10 Organ Recipients Transplanted per Donor 2001 Aust. N.Z. Qld NSW ACT Vic. Tas. SA NT WA No. Organs Transplanted 162 145 26 152 13 71 6 47 622 127 No. of Donors 48 47 7 40 3 25 2 13 185 37 Average per Donor 3.4 3.1 3.7 3.8 4.3 2.8 3.0 3.6 3.4 3.4 Double lungs = 1 organ (1 recipient) Two kidneys = 2 organs
Figure 9.11 Age of Donors Providing Transplanted Kidneys 1997 - 2001 Year 00-04 05-14 15-24 25-34 35-44 45-54 55-64 65-74 75-84 Total 1997 3 (2) 8 32 21 36 46 21 12 3 182 1998 1 (1) 10 37 22 32 33 34 (1*) 14 (1x) 0 183 Australia 1999 4 (3) 11 (2) 24 22 17 32 29 9 (1x) 2 (1x) 150 2000 2 (3) 10 30 24 28 42 34 (1x) 11 1 182 2001 0 (0) 16 32 25 22 44 19 11 1 (x) 170 1997 0 4 14 4 3 9 7 1 0 42 1998 1 (1) 4 8 6 8 7 6 1 0 41 New 1999 0 3 (1) 3 4 4 14 5 4 0 37 Zealand 2000 0 2 9 4 6 12 6 1 0 40 2001 0 0 9 2 7 7 8 1 0 34 ( ) En-Bloc Kidneys * Horseshoe Kidney (Adult) x Double Adult