Download
1 / 7
70 likes | 81 Views
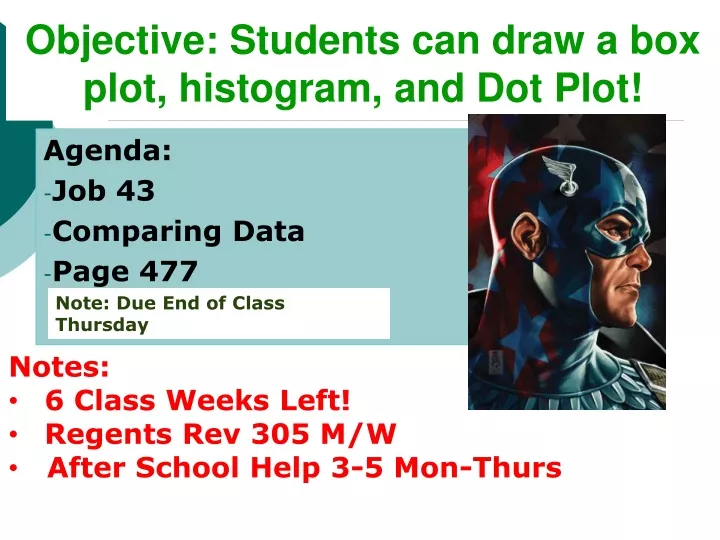
Objective: Students can draw a box plot, histogram, and Dot Plot!. Agenda : Job 43 Comparing Data Page 477. Note: Due End of Class Thursday. Notes: 6 Class Weeks Left! Regents Rev 305 M/W After School Help 3-5 Mon-Thurs.

E N D
Objective: Students can draw a box plot, histogram, and Dot Plot! Agenda: • Job 43 • Comparing Data • Page 477 Note: Due End of Class Thursday • Notes: • 6 Class Weeks Left! • Regents Rev 305 M/W • After School Help 3-5 Mon-Thurs
Objective: Students can draw a box plot, histogram, and Dot Plot! Agenda: Sprint • Job 43 • Comparing Data • Page 477 Note: Due End of Class Thursday • Notes: • 6 Class Weeks Left! • Regents Rev 305 M/W • After School Help 3-5 Mon-Thurs
Mean: How to find? Steps: 1. Stat, Edit, Stat, Calc “1” 2. x =
New Vocabulary: Skewed & Outlier Skewed- Data is more in one direction Outlier – Data way out of the norm SKEWED RIGHT SKEWED Left SYMMETRIC
Dot Plot Steps: 1. Draw a # Line, # equal values by 1’s, 2’s, 10’s, etc 2. Put a dot over value for each number in data 3. Label
Box Plot Steps: 1. Stat, Edit, Stat, Calc “1” Min, Q1, Med, Q3, Max 2. Draw # Line Make box with Med, Q1, Q3 3. Draw Whiskers w Min, Max 4. Label
Histogram Steps: 1. Make Freq Distribution Table (See Ex on left) 2. Make a graph of 1st quadrant as shown above 3. Make Interval on bottom, Even values on y-axes 4. Put 3 Labels COMMON ERROR: Remember to put a Break Symbol if the values do NOT start at 0