Download
1 / 64
640 likes | 797 Views
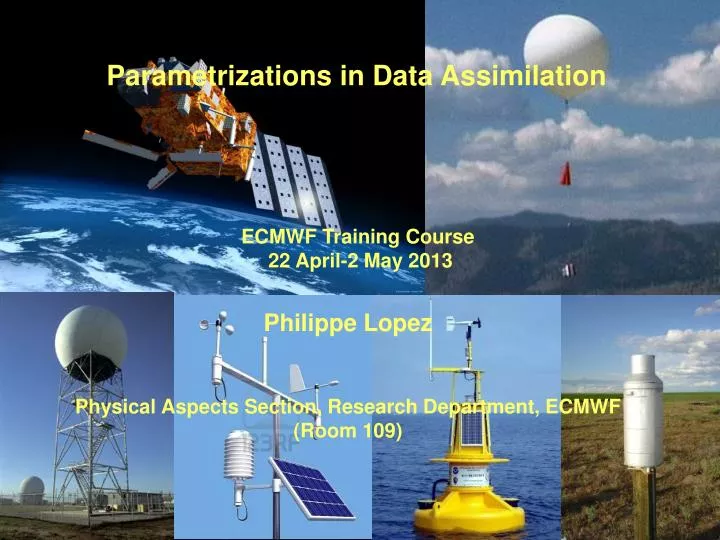
Parametrizations in Data Assimilation. ECMWF Training Course 22 April-2 May 2013. Philippe Lopez Physical Aspects Section, Research Department, ECMWF (Room 109). Parametrizations in Data Assimilation. Introduction An example of physical initialization

E N D
Parametrizations in Data Assimilation ECMWF Training Course 22 April-2 May 2013 Philippe Lopez Physical Aspects Section, Research Department, ECMWF (Room 109)
Parametrizations in Data Assimilation • Introduction • An example of physical initialization • A very simple variational assimilation problem • 3D-Var assimilation • The concept of adjoint • 4D-Var assimilation • Tangent-linear and adjoint coding • Issues related to physical parametrizations in assimilation • Physical parametrizations in ECMWF’s current 4D-Var system • Examples of applications involving linearized physical parametrizations • Summary and conclusions Lecture 3 ¦ Lecture 2 ¦ Lecture 1
Why do we need data assimilation? • By construction, numerical weather forecasts are imperfect: • discrete representation of the atmosphere in space and time (horizontal and • vertical grids, spectral truncation, time step) • subgrid-scale processes (e.g. turbulence, convective activity) need to be • parametrized as functions of the resolved-scale variables. • errors in the initial conditions. • Physical parametrizations used in NWP models are constantly being • improved: • more and more prognostic variables (cloud variables, precipitation, aerosols), • more and more processes accounted for (e.g. detailed microphysics). • However, they remain approximate representations of the true atmospheric • behaviour. • Another way to improve forecasts is to improve the initial state. • The goal of data assimilation is to periodically constrain the initial conditions • of the forecast using a set of accurate observations that provide our best • estimate of the local true atmospheric state.
General features of data assimilation • Goal: to produce an accurate four dimensional representation of the atmospheric state to initialize numerical weather prediction models. • This is achieved by combining in an optimal statistical way all the information • on the atmosphere, available over a selected time window (usually 6 or 12h): • Observations with their accuracies (error statistics), • Short-range model forecast (background) with associated error statistics, • Atmospheric equilibria (e.g. geostrophic balance), • Physical laws (e.g. perfect gas law, condensation) • The optimal atmospheric state found is called the analysis.
Which observations are assimilated? Operationally assimilated since many years ago: * Surface measurements (SYNOP, SHIPS, DRIBU,…), * Vertical soundings (TEMP, PILOT, AIREP, wind profilers,…), * Geostationarysatellites(METEOSAT, GOES,…) Polar orbiting satellites(NOAA, SSM/I, AIRS, AQUA, QuikSCAT,…): - radiances (infrared & passive microwave in clear-sky conditions), - products (motion vectors, total column water vapour, ozone,…). More recently: * Satellite radiances/retrievals in cloudy and rainy regions (SSM/I, TMI,…), * Precipitation measurements from ground-based radars and rain gauges. Still experimental: * Satellite cloud/precipitation radar reflectivities/products (TRMM, CloudSat), * Lidar backscattering/products (wind vectors, water vapour) (CALIPSO), * GPS water vapour retrievals, * Satellite measurements of aerosols, trace gases,.... * Lightning data (TRMM-LIS).
Why physical parametrizations in data assimilation? • In current operational systems, most used observations are directly or indirectly • related totemperature, wind, surface pressureandhumidityoutside cloudy • and precipitation areas (~ 8 million observations assimilated in ECMWF 4D-Var • every 12 hours). • Physical parametrizations are used during the assimilation to link the model’s • prognostic variables (typically: T, u, v, qv and Ps) to the observed quantities • (e.g. radiances, reflectivities,…). • Observations related to clouds and precipitation are starting to be routinely • assimilated, • but how to convert such information into proper corrections of the model’s initial • state (prognostic variables T, u, v, qv and, Ps) is not so straightforward. For instance, problems in the assimilation can arise from the discontinuous or non-linear nature of moist processes.
Improvements are still needed… • More observations are needed to improve the analysis and forecasts of: • Mesoscale phenomena (convection, frontal regions), • Vertical and horizontal distribution of clouds and precipitation, • Planetary boundary layer processes (stratocumulus/cumulus clouds), • Surface processes (soil moisture), • The tropical circulation (monsoons, squall lines, tropical cyclones). • Recent developments and improvements have been achieved in: • Data assimilation techniques (OI 3D-Var 4D-Var Ensemble DA), • Physical parametrizations in NWP models (prognostic schemes, detailed convection and large-scale condensation processes), • Radiative transfer models (infrared and microwave frequencies), • Horizontal and vertical resolutions of NWP models (currently at ECMWF: T1279 ~ 15 km, 91 vertical levels, soon 137 levels), • New satellite instruments (incl. microwave imagers/sounders, precipitation/cloud radars, lidars,…).
To summarize… Observations with errors a priori information from model = background state with errors Data assimilation system (e.g. 4D-Var) Analysis NWP model Forecast • Physical parametrizations are needed in data assimilation: • to link the model variables to the observed quantities, • to evolve the model state in time during the assimilation (e.g. 4D-Var).
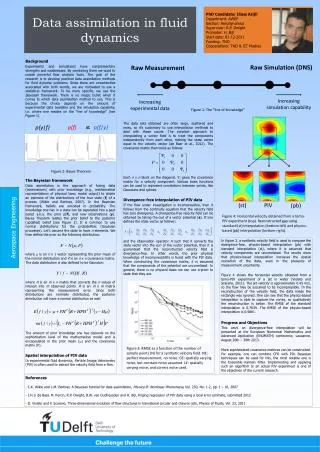
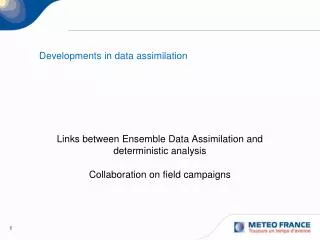
Empirical initialization • Example from Ducrocq et al. (2000), Météo-France: • Using the mesoscale research model Méso-NH (prognostic clouds and precipitation). • Particular focus on strong convective events. • Method: Before running the forecast: • 1) A mesoscale surface analysis is performed (esp. to identify convective cold pools) • 2) the model humidity, cloud and precipitation fields are empirically adjusted to match • ground-based precipitation radar observations and METEOSAT infrared brightness • temperatures. Radar METEOSAT
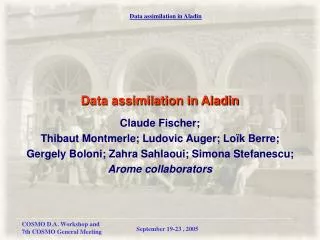
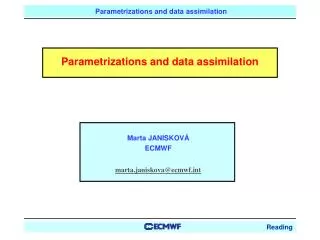
Rain gauges 12h FC from modified analysis + 100 km 12h FC from operational analysis + Nîmes + Ducrocq et al. (2004) 2.5-km resolution model Méso-NH Flash flood over South of France (8-9 Sept 2002) + Nîmes Nîmes radar 12h accumulated precipitation: 8 Sept 12 UTC 9 Sept 2002 00 UTC
In other words: And the analysis error,a, verifies: A very simple example of variational data assimilation • - Short-range forecast (background) of 2m temperature from model: xb with error b. • Simultaneous observation of 2m temperature: yo with error o. • The best estimate of 2m temperature (xa=analysis) minimizes the following cost function: = quadratic distance to background and obs (weighted by their errors) The analysis is a linear combination of the model background and the observation weighted by their respective error statistics.
0D-Var 3D-Var
Important remarks on variational data assimilation • Minimizing the cost function J is equivalent to finding the so-called Best Linear Unbiased Estimator (BLUE) if one can assume that: • - Model background and observation errors are unbiased and uncorrelated, • - theirstatistical distributions are Gaussian. • (then, the final analysis is the maximum likelihood estimator of the true state). • The analysis is obtained by adding corrections to the background which depend • linearly on background-observations departures. • In this linear context, the observation operator (to go from model space to • observation space) must not be too non-linear in the vicinity of the model state, • else the result of the analysis procedure is not optimal. • The result of the minimization depends on the background and observation error statistics (matrices Band R) but also on the Jacobian matrix (H) of the observation operator (H).
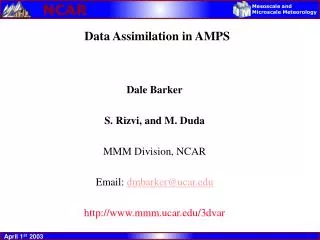
An example of observation operator H: input = model state (T,qv) output = surface convective rainfall rate Jacobians of surface rainfall rate w.r.t. Tandqv Tiedtke (ECMWF’s oper mass-flux scheme) Betts-Miller (adjustment scheme) Marécal and Mahfouf (2002)
0D-Var 3D-Var
cost function J J(xb) Jmini model variable x2 model variable x1 The minimization of the cost function J is usually performed using an iterative minimization procedure Example with control vectorx = (x1,x2)
3D-Var model state analysis time ta Allobservations yo between ta-3h and ta+3h are assumed to be valid at analysis time (ta=1200 UTC here) yo xa xa= final analysis xb xb= model first-guess 9 12 15 time
3 6 9 4D-Var model state Allobservations yo between ta-9h and ta+3h are valid at their actual time analysis time ta initial time t0 yo Model trajectory from corrected initial state xa Model trajectory from first guess xb xb Forecast model is involved in minimization 12 15 time assimilation window Adjoint of forecast model with simplified linearized physics
(T1279 L91) T255 L91 T255 L91 70 35 with in the first minimization with in the second and third minimizations).
As an alternative to the matrix method, adjoint coding can be carried out using a line-by-line approach (what we do at ECMWF). Automatic adjoint code generators do exist, but the output code is not optimized and not bug-free.
Basic rules for line-by-line adjoint coding (1) Adjoint statements are derived from tangent linear ones in a reversed order And do not forget to initialize local adjoint variables to zero !
Basic rules for line-by-line adjoint coding (2) To save memory, the trajectory can be recomputed just before the adjoint calculations. • The most common sources of error in adjoint coding are: • Pure coding errors (often: confusion trajectory/perturbation variables), • Forgotten initialization of local adjoint variables to zero, • Mismatching trajectories in tangent linear and adjoint (even slightly), • Bad identification of trajectory updates:
machine precision reached Perturbation scaling factor
y tangent in x0 Dy(tangent-linear) Dy(non-linear) 0 x0 x Dx(finite size perturbation) Linearity issue • Variational assimilation is based on the strong assumption that the analysis is • performed in a quasi-linear framework. • However, in the case of physical processes, strong non-linearities can occur in • the presence of discontinuous/non-differentiable processes • (e.g. switches or thresholds in cloud water and precipitation formation). • “Regularization” needs to be applied: smoothing of functions, reduction of some perturbations. Precipitation formation rate Cloud water amount
y 0 x Linearity issue Precipitation formation rate threshold Cloud water amount Dy(non-linear) Dy(tangent-linear) = 0 tangent in x0 x0 Dx(finite size perturbation)
q q Saturated background Dry background Jmin OK {Tb, qb} No convergence! saturation T T Illustration of discontinuity effect on cost function shape: Model background = {Tb, qb}; Observation = RRobs Simple parametrization of rain rate: RR = {q qsat(T)} if q > qsat(T), 0 otherwise Single minimum of cost function Several local minima of cost function
Importance of regularization to prevent instabilities in tangent-linear model Evolution of temperature increments (24-hour forecast) with the tangent linear model using different approaches for the exchange coefficient K in the vertical diffusion scheme. Perturbations of K included in TL Perturbations of K set to zero in TL
Corresponding perturbations evolved with tangent-linear model No regularization in convection scheme Importance of regularization to prevent instabilities in tangent-linear model 12-hour ECMWF model integration (T159 L60) Temperature on level 48 (approx. 850 hPa) Finite difference between two non-linear model integrations
Corresponding perturbations evolved with tangent-linear model Regularization in convection scheme (buoyancy & updraught velocity reduced perturb.) Importance of regularization to prevent instabilities in tangent-linear model 12-hour ECMWF model integration (T159 L60) Temperature on level 48 (approx. 850 hPa) Finite difference between two non-linear model integrations
Timing: OK ? Pure coding No M’ M(x+x)M(x) M’x OK ? Yes No Debugging and testing (incl. regularization) M* <M’x,y> = <x,M*y> OK ? No OK ? No OK ? No Forecasts Climate runs M Yes Yes Singular Vectors (EPS) 4D-Var (minim)
A short list of existing LP packages used in operational DA • Tsuyuki (1996): Kuo-type convection and large-scale condensation schemes (FSU 4D-Var). • Mahfouf (1999):full set of simplified physical parametrizations (gravity wave drag currently used in ECMWF operational 4D-Var and EPS). • Janisková et al. (1999): full set of simplified physical parametrizations (Météo-France operational 4D-Var). • Janisková et al. (2002): linearized radiation (ECMWF 4D-Var). • Lopez (2002): simplified large-scale condensation and precipitation scheme (Météo-France). • Tompkins and Janisková (2004):simplified large-scale condensation and precipitation scheme (ECMWF). • Lopez and Moreau (2005): simplified mass-flux convection scheme (ECMWF). • Mahfouf (2005): simplified Kuo-type convection scheme (Environment Canada).
ECMWF operational LP package (operational 4D-Var) Currently used in ECMWF operational 4D-Varminimizations(main simplifications with respect to the full non-linear versions are highlighted in red): • Large-scale condensation scheme:[Tompkins and Janisková 2004] • - based on a uniform PDF to describe subgrid-scale fluctuations of total water, • - melting of snow included, - precipitation evaporation included, - reduction of cloud fraction perturbation and in autoconversion of cloud into rain. • Convection scheme:[Lopez and Moreau 2005] • - mass-flux approach [Tiedtke 1989], • - deep convection (CAPE closure) and shallow convection (q-convergence) are treated, • - perturbations of all convective quantities are included, • - coupling with cloud scheme through detrainment of liquid water from updraught, • - someperturbations (buoyancy, initial updraught vertical velocity) are reduced. • Radiation: TL and AD of longwave and shortwave radiation available [Janisková et al. 2002] • - shortwave: based on Morcrette (1991), only 2 spectral intervals (instead of 6 in non-linear • version), • - longwave: based on Morcrette (1989), called every 2 hours only.
ECMWF operational LP package (operational 4D-Var) • Vertical diffusion: • - mixing in the surface and planetary boundary layers, • - based on K-theory and Blackadar mixing length, • - exchange coefficients based on Louiset al.[1982], near surface, • - Monin-Obukhov higher up, • - mixed layer parametrization and PBL top entrainment recently added. • - Perturbations of exchange coefficients are smoothed (esp. near the surface). • Orographic gravity wave drag:[Mahfouf 1999] • - subgrid-scale orographic effects [Lott and Miller 1997], • -only low-level blocking part is used. • Non-orographic gravity wave drag:[Oor et al. 2010] • - isotropic spectrum of non-orographic gravity waves[Scinocca 2003], • - Perturbations of output wind tendencies below 200 hPa reset to zero. • RTTOV is employed to simulate radiances at individual frequencies (infrared, longwave and microwave, with cloud and precipitation effects included) to compute model–satellite departures in observation space.
Comparison: • Finite difference of two NL integrations TL evolution of initial perturbations • Examination of the accuracy of the linearization for typical analysis increments: • Diagnostics: • mean absolute errors: • relative error change: (improvement if < 0) • here: REF = adiabatic run (i.e. no physical parametrizations in tangent-linear) Impact of linearized physics on tangent-linear approximation typical size of 4D-Var analysis increments
Impact ofoperational vertical diffusion scheme • Temperature EXP - REF 10 20 30 40 50 60 REF = ADIAB 80N 60N 40N 20N 0 20S 40S 60S 80S 12-hour T159 L60 integration • relative improvement [%] X EXP Adiab simp vdif | vdif
Impact of dry + moist physical processes • Temperature EXP - REF 10 20 30 40 50 60 REF = ADIAB 80N 60N 40N 20N 0 20S 40S 60S 80S 12-hour T159 L60 integration relative improvement [%] X EXP Adiab simp vdif | vdif + gwd + radold + lsp + conv
Impact of all physical processes (including new moist physics & radiation) • Temperature EXP - REF 10 20 30 40 50 60 REF = ADIAB 80N 60N 40N 20N 0 20S 40S 60S 80S 12-hour T159 L60 integration relative improvement [%] X X X X EXP Adiab simp vdif | vdif + gwd + radnew + cl_new + conv_new