Download
1 / 1
10 likes | 118 Views
CRAB. Submission time Check status time Output retrieval time. Dynamical Web Page. UDP server. MySQL DB. Write & Update. References. CRAB project: http://cmsdoc.cern.ch/cms/ccs/wm/www/Crab The CMS experiment: http://cmsdoc.cern.ch

E N D
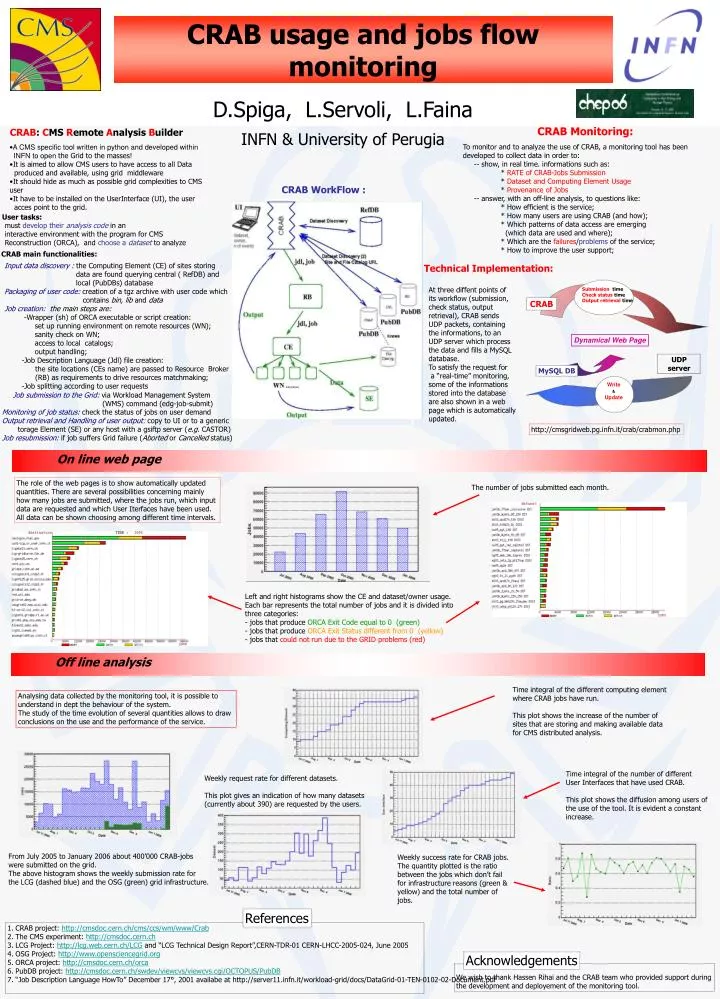
CRAB Submission time Check status time Output retrieval time DynamicalWeb Page UDP server MySQL DB Write & Update References • CRAB project: http://cmsdoc.cern.ch/cms/ccs/wm/www/Crab • The CMS experiment: http://cmsdoc.cern.ch • LCG Project: http://lcg.web.cern.ch/LCG and “LCG Technical Design Report”,CERN-TDR-01 CERN-LHCC-2005-024, June 2005 • OSG Project: http://www.opensciencegrid.org • ORCA project: http://cmsdoc.cern.ch/orca • PubDB project: http://cmsdoc.cern.ch/swdev/viewcvs/viewcvs.cgi/OCTOPUS/PubDB • “Job Description Language HowTo” December 17°, 2001 availabe at http://server11.infn.it/workload-grid/docs/DataGrid-01-TEN-0102-02-Document.pdf CRAB usage and jobs flow monitoring D.Spiga, L.Servoli, L.Faina INFN & University of Perugia CRAB Monitoring: CRAB: CMS Remote Analysis Builder To monitor and to analyze the use of CRAB, a monitoring tool has been developed to collect data in order to: -- show, in real time. informations such as: * RATE of CRAB-Jobs Submission * Dataset and Computing Element Usage * Provenance of Jobs -- answer, with an off-line analysis, to questions like: * How efficient is the service; * How many users are using CRAB (and how); * Which patterns of data access are emerging (which data are used and where); * Which are the failures/problemsof the service; * How to improve the user support; • A CMS specific tool written in python and developed within • INFN to open the Grid to the masses! • It is aimed to allow CMS users to have access to all Data • produced and available, using grid middleware • It should hide as much as possible grid complexities to CMS user • It have to be installed on the UserInterface (UI), the user • acces point to the grid. CRAB WorkFlow : User tasks: must develop theiranalysis code in an interactive environment with the program for CMS Reconstruction (ORCA), and choose a dataset to analyze CRAB main functionalities: • Input data discovery :the Computing Element (CE) ofsites storing • data are found querying central ( RefDB) and • local (PubDBs) database • Packaging of user code:creation of a tgz archive with user code which • contains bin, lib and data • Job creation: the main steps are: • -Wrapper (sh) of ORCA executable or script creation: • set up running environment on remote resources (WN); • sanity check on WN; • access to local catalogs; • output handling; • -Job Description Language (Jdl) file creation: • the site locations (CEs name) are passed to Resource Broker • (RB) as requirements to drive resources matchmaking; • -Job splitting according to user requests Technical Implementation: At three diffent points of its workflow (submission, check status, output retrieval), CRAB sends UDP packets, containing the informations, to an UDP server which process the data and fills a MySQL database. To satisfy the request for a “real-time” monitoring, some of the informations stored into the database are also shown in a web page which is automatically updated. • Job submission to the Grid:via Workload Management System • (WMS) command (edg-job-submit) • Monitoring of job status: check the status of jobs on user demand • Output retrieval and Handling of user output: copy to UI or to a generic • torage Element (SE) or any host with a gsiftp server (e.g. CASTOR) • Job resubmission:if job suffers Grid failure (Aborted or Cancelled status) http://cmsgridweb.pg.infn.it/crab/crabmon.php On line web page The role of the web pages is to show automatically updated quantities. There are several possibilities concerning mainly how many jobs are submitted, where the jobs run, which input data are requested and which User Iterfaces have been used. All data can be shown choosing among different time intervals. The number of jobs submitted each month. Left and right histograms show the CE and dataset/owner usage. Each bar represents the total number of jobs and it is divided into three categories: - jobs that produce ORCA Exit Code equal to 0 (green) - jobs that produce ORCA Exit Status different from 0 (yellow) - jobs that could not run due to the GRID problems (red) Off line analysis Time integral of the different computing element where CRAB jobs have run. This plot shows the increase of the number of sites that are storing and making available data for CMS distributed analysis. Analysing data collected by the monitoring tool, it is possible to understand in dept the behaviour of the system. The study of the time evolution of several quantities allows to draw conclusions on the use and the performance of the service. Time integral of the number of different User Interfaces that have used CRAB. This plot shows the diffusion among users of the use of the tool. It is evident a constant increase. Weekly request rate for different datasets. This plot gives an indication of how many datasets (currently about 390) are requested by the users. From July 2005 to January 2006 about 400’000 CRAB-jobs were submitted on the grid. The above histogram shows the weekly submission rate for the LCG (dashed blue) and the OSG (green) grid infrastructure. Weekly success rate for CRAB jobs. The quantity plotted is the ratio between the jobs which don’t fail for infrastructure reasons (green & yellow) and the total number of jobs. Acknowledgements We wish to thank Hassen Rihai and the CRAB team who provided support during the development and deployement of the monitoring tool.