Download
1 / 46
550 likes | 952 Views
Variability. Measures of Variability. Measure of Variability (Dispersion, Spread). Variance, standard deviation Range Inter-Quartile Range Pseudo-standard deviation. Range. Range. Definition Let min = the smallest observation Let max = the largest observation Then Range =max - min.

E N D
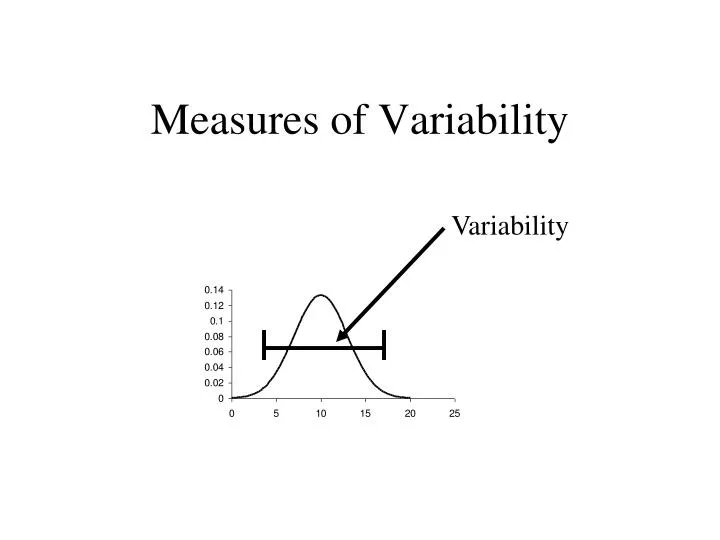
Variability Measures of Variability
Measure of Variability (Dispersion, Spread) • Variance, standard deviation • Range • Inter-Quartile Range • Pseudo-standard deviation
Range Definition Let min = the smallest observation Let max = the largest observation Then Range =max - min Range
Inter-Quartile Range (IQR) Definition Let Q1 = the first quartile, Q3 = the third quartile Then the Inter-Quartile Range = IQR = Q3 - Q1
Inter-Quartile Range 50% 25% 25% Q1 Q3
Example The data Verbal IQ on n = 23 students arranged in increasing order is: 80 82 84 86 86 89 90 94 94 95 95 96 99 99 102 102 104 105 105 109 111 118 119
Example The data Verbal IQ on n = 23 students arranged in increasing order is: 80 82 84 86 86 89 90 94 94 95 95 96 99 99 102 102 104 105 105 109 111 118 119 Q3 = 105 min= 80 Q1 = 89 Q2 = 96 max= 119
Range Range = max – min = 119 – 80 = 39 Inter-Quartile Range = IQR = Q3 - Q1 = 105 – 89 = 16
Some Comments • Range and Inter-quartile range are relatively easy to compute. • Range slightly easier to compute than the Inter-quartile range. • Range is very sensitive to outliers (extreme observations)
Sample Variance Let x1, x2, x3, … xn denote a set of n numbers. Recall the mean of the n numbers is defined as:
The numbers are called deviations from the the mean
The sum is called the sum of squares of deviations from the the mean. Writing it out in full: or
The Sample Variance Is defined as the quantity: and is denoted by the symbol Comment One might think that the divisor in variance should be n. For certain reasons it was found that a divisor of n – 1, resulted in a estimator with a particular desirable property –unbiasedness
i 1 2 3 4 5 xi 10 15 21 7 13 Example Let x1, x2, x3, x3 , x4, x5 denote a set of 5 denote the set of numbers in the following table.
Then = x1 + x2 + x3 + x4 + x5 = 10 + 15 + 21 + 7 + 13 = 66 and
i 1 2 3 4 5 xi 10 15 21 7 13 di -3.2 1.8 7.8 -6.2 -0.2 The deviations from the mean d1, d2, d3, d4, d5 are given in the following table.
The sum and
The Sample Standard Deviation s Definition: The Sample Standard Deviation is defined by: Hence the Sample Standard Deviation, s, is the square root of the sample variance.
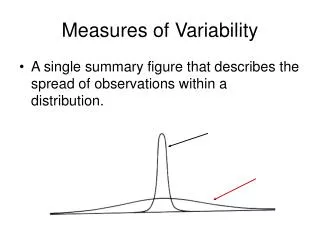
Interpretations of s • In Normal distributions • Approximately 2/3 of the observations will lie within one standard deviation of the mean • Approximately 95% of the observations lie within two standard deviations of the mean • In a histogram of the Normal distribution, the standard deviation is approximately the distance from the mode to the inflection point
Mode Inflection point s
2/3 s s
Example A researcher collected data on 1500 males aged 60-65. The variable measured was cholesterol and blood pressure. • The mean blood pressure was 155 with a standard deviation of 12. • The mean cholesterol level was 230 with a standard deviation of 15 • In both cases the data was normally distributed
Interpretation of these numbers • Blood pressure levels vary about the value 155 in males aged 60-65. • Cholesterol levels vary about the value 230 in males aged 60-65.
2/3 of males aged 60-65 have blood pressure within 12 of 155. Ii.e. between 155-12 =143 and 155+12 = 167. • 2/3 of males aged 60-65 have Cholesterol within 15 of 230. i.e. between 230-15 =215 and 230+15 = 245.
95% of males aged 60-65 have blood pressure within 2(12) = 24 of 155. Ii.e. between 155-24 =131 and 155+24 = 179. • 95% of males aged 60-65 have Cholesterol within 2(15) = 30 of 230. i.e. between 230-30 =200 and 230+30 = 260.
A Computing formula for: Sum of squares of deviations from the the mean: The difficulty with this formula is thatwill have many decimals. The result will be that each term in the above sum will also have many decimals.
The sum of squares of deviations from the the meancan also be computed using the following identity:
Example The data Verbal IQ on n = 23 students arranged in increasing order is: 80 82 84 86 86 89 90 94 94 95 95 96 99 99 102 102 104 105 105 109 111 118 119
= 80 + 82 + 84 + 86 + 86 + 89 + 90 + 94 + 94 + 95 + 95 + 96 + 99 + 99 + 102 + 102 + 104 + 105 + 105 + 109 + 111 + 118 + 119 = 2244 = 802 + 822 + 842 + 862 + 862 + 892 + 902 + 942 + 942 + 952 + 952 + 962 + 992 + 992 + 1022 + 1022 + 1042 + 1052 + 1052 + 1092 + 1112 + 1182 + 1192 = 221494
A quick (rough) calculation of s The reason for this is that approximately all (95%) of the observations are between and Thus
Example Verbal IQ on n = 23 students min = 80 and max = 119 This compares with the exact value of s which is 10.782. The rough method is useful for checking your calculation of s.
The Pseudo Standard Deviation (PSD) Definition: The Pseudo Standard Deviation (PSD)is defined by:
Properties • For Normal distributions the magnitude of the pseudo standard deviation (PSD) and the standard deviation (s) will be approximately the same value • For leptokurtic distributions the standard deviation (s) will be larger than the pseudo standard deviation (PSD) • For platykurtic distributions the standard deviation (s) will be smaller than the pseudo standard deviation (PSD)
Example Verbal IQ on n = 23 students Inter-Quartile Range = IQR = Q3 - Q1 = 105 – 89 = 16 Pseudo standard deviation This compares with the standard deviation