Download
1 / 1
10 likes | 144 Views
M. Cardoso*, G. Hurtt*, B. Moore* , C. Nobre † and E. Prins ‡. Dynamics of Amazonian Fires. * Complex Systems Research Center / Institute for the Study of Earth, Oceans and Space University of New Hampshire, Durham, NH, 03824 USA

E N D
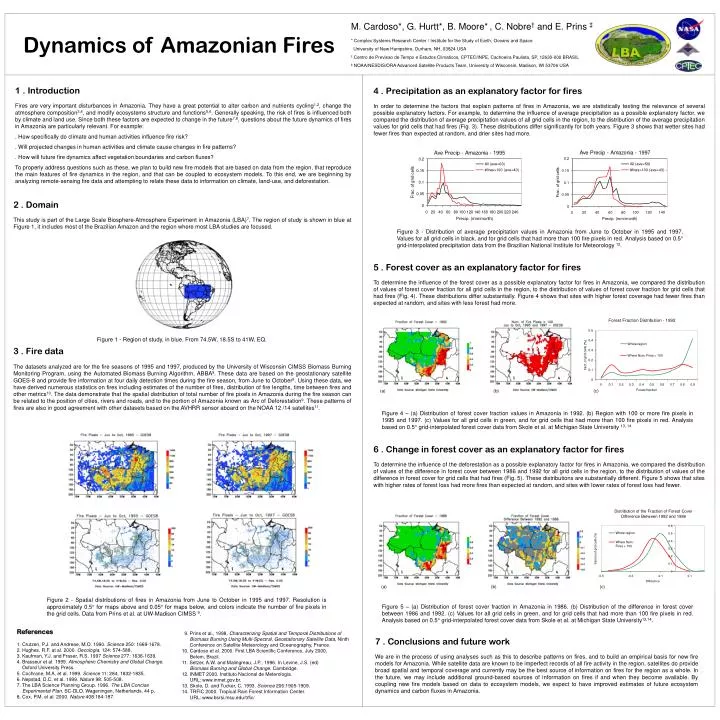
M. Cardoso*, G. Hurtt*, B. Moore*, C. Nobre† and E. Prins ‡ Dynamics of Amazonian Fires * Complex Systems Research Center / Institute for the Study of Earth, Oceans and Space University of New Hampshire, Durham, NH, 03824 USA † Centro de Previsao de Tempo e Estudos Climaticos, CPTEC/INPE, Cachoeira Paulista, SP, 12630-000 BRASIL ‡ NOAA/NESDIS/ORA Advanced Satellite Products Team, University of Wisconsin, Madison, WI 53706 USA 1 . Introduction Fires are very important disturbances in Amazonia. They have a great potential to alter carbon and nutrients cycling1,2, change the atmosphere composition3,4, and modify ecosystems structure and functions5,6. Generally speaking, the risk of fires is influenced both by climate and land use. Since both these factors are expected to change in the future7,8, questions about the future dynamics of fires in Amazonia are particularly relevant. For example: . How specifically do climate and human activities influence fire risk? . Will projected changes in human activities and climate cause changes in fire patterns? . How will future fire dynamics affect vegetation boundaries and carbon fluxes? To properly address questions such as these, we plan to build new fire models that are based on data from the region, that reproduce the main features of fire dynamics in the region, and that can be coupled to ecosystem models. To this end, we are beginning by analyzing remote-sensing fire data and attempting to relate these data to information on climate, land-use, and deforestation. 4 . Precipitation as an explanatory factor for fires In order to determine the factors that explain patterns of fires in Amazonia, we are statistically testing the relevance of several possible explanatory factors. For example, to determine the influence of average precipitation as a possible explanatory factor, we compared the distribution of average precipitation values of all grid cells in the region, to the distribution of the average precipitation values for grid cells that had fires (Fig. 3). These distributions differ significantly for both years. Figure 3 shows that wetter sites had fewer fires than expected at random, and drier sites had more. 2 . Domain This study is part of the Large Scale Biosphere-Atmosphere Experiment in Amazonia (LBA)7. The region of study is shown in blue at Figure 1, it includes most of the Brazilian Amazon and the region where most LBA studies are focused. Figure 3 - Distribution of average precipitation values in Amazonia from June to October in 1995 and 1997. Values for all grid cells in black, and for grid cells that had more than 100 fire pixels in red. Analysis based on 0.5 grid-interpolated precipitation data from the Brazilian National Institute for Meteorology 12. 5 . Forest cover as an explanatory factor for fires To determine the influence of the forest cover as a possible explanatory factor for fires in Amazonia, we compared the distribution of values of forest cover fraction for all grid cells in the region, to the distribution of values of forest cover fraction for grid cells that had fires (Fig. 4). These distributions differ substantially. Figure 4 shows that sites with higher forest coverage had fewer fires than expected at random, and sites with less forest had more. Figure 1 - Region of study, in blue. From 74.5W, 18.5S to 41W, EQ. 3 . Fire data The datasets analyzed are for the fire seasons of 1995 and 1997, produced by the University of Wisconsin CIMSS Biomass Burning Monitoring Program, using the Automated Biomass Burning Algorithm, ABBA9. These data are based on the geostationary satellite GOES-8 and provide fire information at four daily detection times during the fire season, from June to October9. Using these data, we have derived numerous statistics on fires including estimates of the number of fires, distribution of fire lengths, time between fires and other metrics10. The data demonstrate that the spatial distribution of total number of fire pixels in Amazonia during the fire season can be related to the position of cities, rivers and roads, and to the portion of Amazonia known as Arc of Deforestation9. These patterns of fires are also in good agreement with other datasets based on the AVHRR sensor aboard on the NOAA 12 /14 satellites11. (a) (b) (c) Figure 4 – (a) Distribution of forest cover fraction values in Amazonia in 1992. (b) Region with 100 or more fire pixels in 1995 and 1997. (c) Values for all grid cells in green, and for grid cells that had more than 100 fire pixels in red. Analysis based on 0.5 grid-interpolated forest cover data from Skole et al. at Michigan State University 13, 14 6 . Change in forest cover as an explanatory factor for fires To determine the influence of the deforestation as a possible explanatory factor for fires in Amazonia, we compared the distribution of values of the difference in forest cover between 1986 and 1992 for all grid cells in the region, to the distribution of values of the difference in forest cover for grid cells that had fires (Fig. 5). These distributions are substantially different. Figure 5 shows that sites with higher rates of forest loss had more fires than expected at random, and sites with lower rates of forest loss had fewer. (a) (b) (c) Figure 2 - Spatial distributions of fires in Amazonia from June to October in 1995 and 1997. Resolution is approximately 0.5 for maps above and 0.05 for maps below, and colors indicate the number of fire pixels in the grid cells. Data from Prins et al. at UW-Madison CIMSS 9. Figure 5 – (a) Distribution of forest cover fraction in Amazonia in 1986. (b) Distribution of the difference in forest cover between 1986 and 1992. (c) Values for all grid cells in green, and for grid cells that had more than 100 fire pixels in red. Analysis based on 0.5 grid-interpolated forest cover data from Skole et al. at Michigan State University13,14. References 1. Crutzen, P.J. and Andreae, M.O. 1990. Science 250: 1669-1678. 2. Hughes, R.F. at al. 2000. Oecologia, 124: 574-588. 3. Kaufman, Y.J. and Fraser, R.S. 1997Science 277: 1636-1639. 4. Brasseur et al. 1999. Atmospheric Chemistry and Global Change. Oxford University Press. 5. Cochrane, M.A. et al. 1999. Science 11: 284, 1832-1835. 6. Nepstad, D.C. et al. 1999. Nature 98: 505-508. 7. The LBA Science Planning Group. 1996. The LBA Concise Experimental Plan. SC-DLO, Wageningen, Netherlands. 44 p. 8. Cox, P.M. et al. 2000. Nature 408:184-187. 9. Prins et al., 1998, Characterizing Spatial and Temporal Distributions of Biomass Burning Using Multi-Spectral, Geostationary Satellite Data, Ninth Conference on Satellite Meteorology and Oceanography, France. 10. Cardoso et al. 2000. First LBA Scientific Conference, July 2000, Belem, Brazil. 11. Setzer, A.W. and Malingreau, J.P., 1996. In Levine, J.S. (ed) Biomass Burning and Global Change. Cambridge. 12. INMET 2000. Instituto Nacional de Meterologia. URL: www.inmet.gov.br. 13. Skole, D. and Tucker, C. 1993. Science 206:1905-1909. 14. TRFIC 2000. Tropical Rain Forest Information Center. URL: www.bsrsi.msu.edu/trfic/ 7 . Conclusions and future work We are in the process of using analyses such as this to describe patterns on fires, and to build an empirical basis for new fire models for Amazonia. While satellite data are known to be imperfect records of all fire activity in the region, satellites do provide broad spatial and temporal coverage and currently may be the best source of information on fires for the region as a whole. In the future, we may include additional ground-based sources of information on fires if and when they become available. By coupling new fire models based on data to ecosystem models, we expect to have improved estimates of future ecosystem dynamics and carbon fluxes in Amazonia.