Download
1 / 14
150 likes | 159 Views
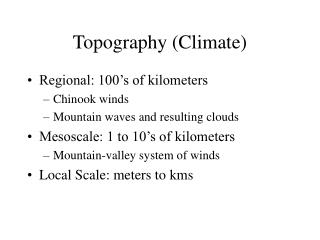
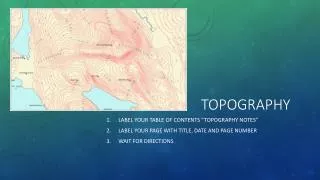
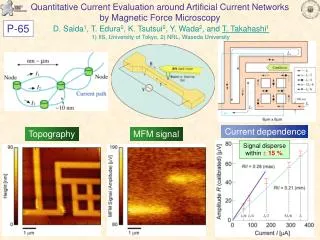
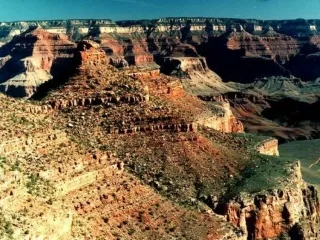
Presentation on Topography. Topography. The lay of the land. Shows relief using contour lines. Relief- highs and lows of Earth’s surface. Relief can be calculated Take the difference between the highest point and the lowest. Ex: Mountain peak 20 m. lake 10m 20m- 10m= 10m

E N D
Presentation on Topography www.assignmentpoint.com
Topography • The lay of the land. • Shows relief using contour lines. • Relief- highs and lows of Earth’s surface. • Relief can be calculated • Take the difference between the highest point and the lowest. • Ex: Mountain peak 20 m. lake 10m • 20m- 10m= 10m • The relief of this area is 10m www.assignmentpoint.com
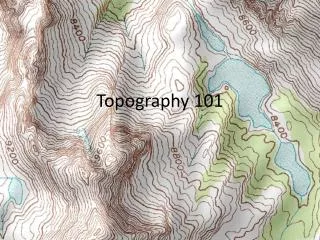
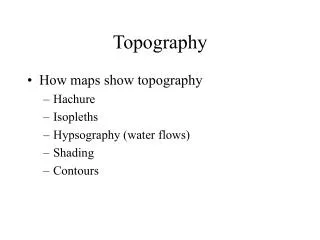
Reading a topographic map- Contour Lines • Lines on topographic maps. • Connect points of equal elevation. • Everything connected to that line has the same elevation. • Elevation- the distance something is above sea level. Sea level= 0m or 0ft. www.assignmentpoint.com
Reading a topographic map- Contour Intervals • Contour interval- gives the difference in elevation between 2 contour lines. • Another indicator of height. • Shown on maps as C.I.= 10ft. • Used to count contour lines. How it will look on a map C.I.= 1000ft www.assignmentpoint.com
Reading a topographic map- Index Contours • A index contour is a contour line that is accentuated in thickness and is labeled with the appropriate measure of elevation. • Index contours occur every fifth contour line. • Help the map user read elevations on a map. www.assignmentpoint.com Red arrows indicate location of index contours.
Reading a topographic map- Streams • The direction a streams is flowing is shown on a topographic map by the way a contour line crosses the stream. • Streams are shown as a blue line on maps. • When contour lines cross a stream it looks like an upside down V. • The point in the V points upstream. It opens in the direction the water is flowing. www.assignmentpoint.com
Reading a topographic map- Depression Contours • Depression contours show areas of lower elevation. • Drawn like contour lines with marks on the inside. • Hachure marks- tick marks on inside of closed circle. www.assignmentpoint.com
Reading a topographic map- Hills • Hills are represented on a topographic map by a series of concentric contour lines in a rough circle www.assignmentpoint.com
Reading a topographic map- Slope • Closely spaced contour lines represent steep slopes. • Widely spaced contour lines represent gentle slopes. www.assignmentpoint.com
Reading a topographic map- Benchmarks • A benchmark is a place where exact elevation is known. • Shown by a B.M. on map • Ex: BM 60 www.assignmentpoint.com
Reading a topographic map- Colors • The colors on a topographic map are symbolic of different map features. • Blue = water • Green = forest • Brown = contour lines • Black = cultural features (buildings, place names, boundary lines, roads, etc.) • Red = principal roads • Pink = urban areas • Purple = revisions to an older map, compiled from aerial photos. If an area has become urbanized, this may be shown as purple shading on the new, revised map. www.assignmentpoint.com
Reading a topographic map- Map Scale • Map scale indicates your distance along the ground, or the amount of ground covered by the map. • USGS- United States Geologic Survey • Ratio- 1:24000 • one unit on the map is equal to 24,000 units of the same size on the ground. • Ex:1 inch on the map = 24000 inches on Earth. • Or after converting 1 inch = 2000ft. • Bar scale-indicated by a line or bar with distances marked in miles, feet, or kilometers. www.assignmentpoint.com
Reading a topographic map- Map Scale www.assignmentpoint.com
Reading a topographic map- Profiles • A topographic profile is a cross-sectional view along a line drawn through a portion of a topographic map. • It is like taking a slice out of a portion of the Earth and looking at it from the side. www.assignmentpoint.com