Download
1 / 11
110 likes | 430 Views
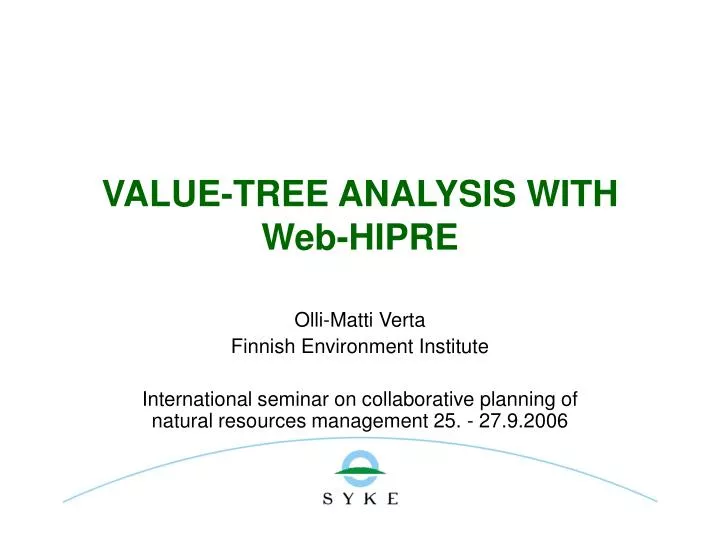
VALUE-TREE ANALYSIS WITH Web-HIPRE. Olli-Matti Verta Finnish Environment Institute International seminar on collaborative planning of natural resources management 25. - 27.9.2006. OUTLINE. DESCRIPTION OF DECISION ANALYSIS VALUE-TREE ANALYSIS EXAMPLES OF VALUE-TREE ANALYSIS WITH Web-HIPRE

E N D
VALUE-TREE ANALYSIS WITH Web-HIPRE Olli-Matti Verta Finnish Environment Institute International seminar on collaborative planning of natural resources management 25. - 27.9.2006
OUTLINE • DESCRIPTION OF DECISION ANALYSIS • VALUE-TREE ANALYSIS • EXAMPLES OF VALUE-TREE ANALYSIS WITH Web-HIPRE • Selecting a car • Regulation policy for Lake Päijänne
WHAT IS DECISION ANALYSIS ? • DECISION ANALYSIS = Methods applied in structuring and analyzing extensive and complex decision problems dealing with subjective preferences and incommensurable criteria. • The idea is to define, decompose and structure issues that are involving the forthcoming decision. • Methods are used to model subjective preferences. • The objective is to create a learning process, after which the decision process can be brought to a considered solution.
ABOUT Web-HIPRE • A VALUE-TREE ANALYSIS TOOL • Developed in Systems Analysis Laboratory in Helsinki University of Technology • Available in the internet www.hipre.hut.fi • Instructions and examples available as well in the internet ( www.hipre.hut.fi, www.decisionarium.tkk.fi, www.environment.sal.tkk.fi )
MULTI-ATTRIBUTE VALUE THEORY – VALUE-TREE ANALYSIS(Keeney & Raiffa 1976) • Objectives, criteria and alternatives are structured in a hierarchical form (=value-tree) • The best alternative is calculated by weighting the importance of variables • Variable weights are set so, that they reflect the decision maker’s preferences Keeney R.L., Raiffa H. 1976. Decisions with Multiple Objectives: Preferences and Value Tradeoffs. New York: John Wiley & Sons.
STRUCTURE OF THE VALUE TREE OVERALL GOAL GENERAL OBJECTIVES ATTRIBUTES/CRITERIA ALTERNATIVES
MATHEMATICS • Additive value-function • Overall value of each alternative • where v and vi, i=1,2,…,n are scaled from 0 to 1, and , 1>0. Xi = criteria vi(xi) = value of ith alternative according to ith criteria i = importance (weight) of ith criteria
MATHEMATICAL EXAMPLE v(1) = (0,7*0,9 + 0,3*0,2)*0,8 + (0,4*0,1 + 0,6*0,3)*0,2 = 0,552 + 0,044 = 0,596 v(2) = (0,7*0,4 + 0,3*0,3)*0,8 + (0,4*0,9 + 0,6*1,0)*0,2 = 0,296 + 0,192 = 0,488 v(1) = 0,596 v(2) = 0,488 OVERALL GOAL GENERAL OBJECTIVES =0,8 =0,2 =0,6 =0,7 =0,3 =0,4 ATTRIBUTES/CRITERIA v1 = 0,9 v2 = 0,4 v1 = 0,2 v2 = 0,3 v1 = 0,1 v2 = 0,9 v1 = 0,3 v2 = 1,0 ALT. 1 ALT. 2 ALTERNATIVES
WHY VALUE-TREE ANALYSIS ? • ONE DECISION MAKER • Structure the decision problem systematically • Study the importance of the decision objectives and criteria • Examine the preferences of the alternatives • SEVERAL DM’S • Structure the decision problem systematically • Pay attention to • shared objectives and values • conflicting objectives, values and perspectives • Create common understanding about • the decision at hand • other stakeholders’ viewpoints TO HELP THE DECISION MAKER(S) TO UNDERSTAND THE DECISION SITUATION AND MAKE A CONCIDERED AND WELL ADVISED SOLUTION TO THE PROBLEM
STEP 1 STEP 2 STEP 3 STEP 4 STEP 5 STEP 6 STEP 7 STEP 5: DEFINE WEIGHTS FOR ATTRIBUTES • TASK: • Select the attribute in which the change from the worst level to the best level is the most significant, and give this attribute a weight of 100. • Select the attribute in which the change is the second most significant, and give this attribute a weight from 0 to 100 so that it reflects the significance of the attribute in comparison to the most significant attribute. • etc. • Material, where impacts of water level fluctuation on each criteria in each selected date were represented, was sent home for every steering group member to become acquainted with. • Work-shop, where weighting of attributes was done together with expert assistance, was held for steering group before individual interviews to get the weighting done right. • An interactive, iterative and illustrative computer aided weighting of attributes was done in the individual interviews.