Download
1 / 62
640 likes | 852 Views
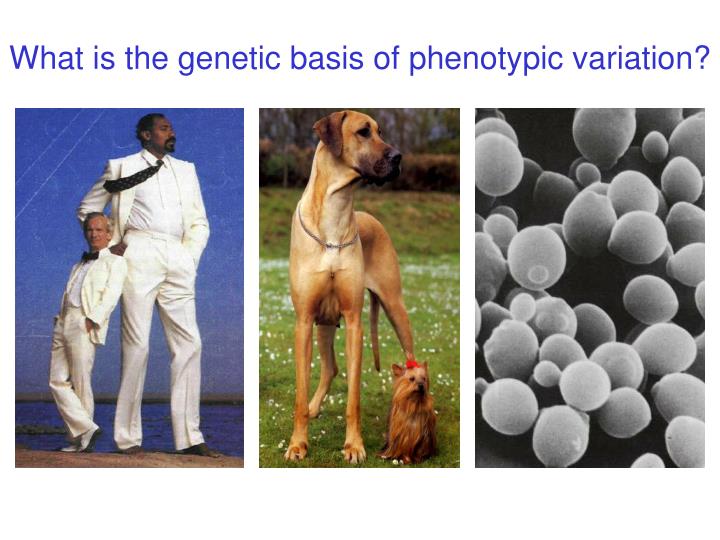
What is the genetic basis of phenotypic variation?. Genetics of gene expression. Why study genetics of gene expression?. mRNA. DNA. Protein. Phenotypes. Regulatory variation is source of intraspecific differences and evolutionary change between species.

E N D
Why study genetics of gene expression? mRNA DNA Protein Phenotypes • Regulatory variation is source of intraspecific differences and evolutionary change between species • Connection between genotypes and organismal phenotypes • Genetic architecture as model for other quantitative traits • Genetics as tool to probe regulatory networks
… Transcript variation in a yeast cross Lab (BY) Wine (RM) profile gene expression determine genome segregation correlate genotype with transcript abundance
Comparison of gene expression in two strains RM BY Isolate RNA Isolate RNA Label Label Hyb vs. reference Hyb vs. reference arrays cover all yeast genes ~6000 compare using Wilcoxon-Mann-Whitney rank test 2932 genes differ at FDR = 0.05 Science 2002
Genotyping by hybridization to oligo arrays Affymetrix yeast chips contain 134,175 oligos (25 bp) from lab strain lab strain wine strain genomic DNA hybridize if wine strain contains polymorphism relative to lab strain, hybe signal ~3000 reproducible differences: lower bound one change per 1000 bp
Genotyping and phenotyping segregants x Culture ... Seg 1 Seg 2 Seg 112 mRNA expression Oligo Genotyping
Testing for linkage in segregants Seg 1 Seg 2 Seg 3 Seg 4 Seg 5 Linkage Seg 1 Seg 2 Seg 5 Seg 3 Seg 4 No linkage inherit RM inherit BY 2984 genes link at FDR = 0.05 Science 2002
Example of mRNA linkage 0.2 0 -0.2 -0.4 fold change (log2) -0.6 -0.8 -1 -1.2 -1.4 all seg BY parent RM parent seg inherit B@marker seg inherit R@marker
Low (10%) Average (29%) High (94%) Variance explained by detected loci fraction of loci fraction of genetic variance PNAS 2005
Estimating genetic complexity Assumption: genetics controlled by additive loci of equal effect Single-locus genetics: 4-5% of transcripts More than 2 loci: 75% or more More than 4 loci: 50% or more More than 8 loci: 20% or more Best-fit model: 60% of transcripts controlled by 1-10 loci 40% of transcripts more complex PNAS 2005
Complexity I: multiple additive loci of same sign most segregants fall between parent means 729 traits pass at FDR = 0.05 PNAS 2005
Complexity II: transgressive segregation most segregants fall outside parent means developed formal test with high power to detect transgression (21 seg ≥ 2 SD outside) 1716 traits pass at FDR = 0.05 PNAS 2005
Two-locus inheritance with transgression 3 2.5 2 1.5 fold change (log2) 1 0.5 0 -0.5 -1 -1.5 all seg BY parent RM parent seg inherit BY:BY seg inherit RM:RM seg inherit RM:BY seg inherit BY:RM seg inherit RM:X seg inherit BY:X seg inherit X:RM seg inherit X:BY
Complexity III: interacting loci segregant mean differs from mid-parent mean 835 traits pass at FDR = 0.05 PNAS 2005
Local regulatory variation 1431 transcripts (25%) link to marker closest to encoding gene cis-regulatory (allele-specific) auto-regulatory feedback ? PLoS Genet 2005
Testing allele-specific expression diploid hybrid 44 of 77 self-linkers show ASE at p < .05 2 of 16 trans-linkers show ASE at p < .05 PLoS Genet 2005
Allele-specific expression of TIP1 R 4 2 R 4 1 2 1 2 1 2 1 1 4 4 D RM allele intensity D D B B 0 0 BY allele intensity Genome Res 2005
More SNPs in regulatory regions of self-linkers PLoS Genet 2005
What are the regulatory polymorphisms? -200 -100 START SPF1 BY:[TA]10CGGAT RM:[TA]14CATAT ** Fraenkel Lab - Yeast regulatory map
Trans-acting regulatory variation 3055 messages link to 100-250 distinct loci Is the distribution of linkages random?
AMN1 mito. stress HAP1 ribo. proteins LEU2 SIR2 MAT GPA1 CAT5 URA3 Genomewide distribution of trans linkages linkages genome location 1840 messages link to 15 loci (59% of all linking traits) Science 2002
Positional cloning of AMN1 chr 2 locus: inherit RM chr 2 locus:inherit BY expression of cluster shows linkage recombinants narrow region to a single gene: AMN1 BY allele of AMN1 carries missense mutation at conserved site Nat Genet 2003
AMN1: negative regulator of mitotic exit network Colman-Lerner et al. Cell107:739-750 2001 Wang et al. Cell112:697-709 2003
BY RM RM DAMN1 Molecular proof of effect of AMN1 Effect on gene expression Effect on clumpy growth Nat Genet 2003
Positional cloning of GPA1 chr 8 locus: inherit RM chr 8 locus:inherit BY expression of cluster shows linkage GPA1 maps to region of linkage and encodes a G protein alpha subunit coupled to pheromone receptors BY allele of GPA1 carries missense mutation at conserved site Nat Genet 2003
Effect of GPA1 S469I on pheromone response genes Nat Genet 2003
Two-dimensional clustering of linkages MAT/GPA1 PLoS Biol 2005; Nature 2005
Epistasis between MAT and GPA1 in segregants GYP8 a-specific SAG1a-specific MATa MATa MATa MATa Nature 2005
Epistasis between MAT and GPA1 in isogenic strains GYP8 a-specific SAG1a-specific MATa MATa MATa MATa Nature 2005
Are trans-regulatory loci transcription factors? “This project is very creative but I’m afraid it does not make sense … why not simply use a set of knockouts for every yeast transcription factor?” -Anonymous NIH reviewer
Analysis of trans-acting loci by molecular function Nat Genet 2003
Comparison of whole genomes at nucleotide resolution using Affymetrix™ yeast tiling microarraysORGenome resequencing without a genome center 5’-CTGAATATGCATTGAAATAAGATCC ATATGCATTGAAATAAGATCCAAAC GCATTGAAATAAGATCCAAACAGCT TGAAATAAGATCCAAACAGCTAAGA ATAAGATCCAAACAGCTAAGAACAG GATCCAAACAGCTAAGAACAGGAAA 3’-GACTTATACGTAACTTTATTCTATGTTTGTCGATTCTTGTCCTTT probes sample Hybridization efficiency is acutely sensitive to mismatches when oligonucleotides are short Perfect match 1 bp mismatch Maskos and Southern, NAR (1992)
Affymetrix Yeast tiling arrays provide complete and redundant coverage of the yeast genome 5’-CTGAATATGCATTGAAATAAGATCC ATATGCATTGAAATAAGATCCAAAC GCATTGAAATAAGATCCAAACAGCT TGAAATAAGATCCAAACAGCTAAGA ATAAGATCCAAACAGCTAAGAACAG GATCCAAACAGCTAAGAACAGGAAA 3’-GACTTATACGTAACTTTATTCTATGTTTGTCGATTCTTGTCCTTT probes sample
Comparison of two genomes to model decrease in hybridization due to SNPs Nonpolymorphic strain S288C • Reference sequence represented on array • Hybridization intensities reflect maximal binding of complementary DNA Polymorphic strain RM11-1A • High quality sequence of wild strain • 24,848 isolated SNPs overlapped by 123,016 probes • Hybridization intensities reflect effect of mismatch on maximal binding
Hybridization decrease in presence of SNP is related to position within probe
Model decrease in hybridization due to SNP at Probe(i) • Position in SNP (j) • PM-MM for reference sequence • GC content • Local sequence context (t)
Model decrease in hybridization due to SNP Model inputs • position of SNP in probe • PM minus MM intensity for reference sequence • probe GC content • local sequence context
Likelihood site is polymorphic Prediction signal = log Likelihood site is nonpolymorphic Use model to call polymorphic sites experimental observation xi
A positive SNP prediction is associated with a region of elevated signal
Analysis of sequenced strain YJM789identifies >90% of 30,690 known SNPs
Collection of independent spontaneous mutants CAN1 YPD 60mg/L canavanine FCY1 GAP1 3mM D-His +1.5mM D-Ser 1mM 5-fluorocytosine
Selection of spontaneous mutants associated with small number of additional SNPs genome-wide
CEN.PK CANR mutants have unique mutations and common SNPs in CAN1
Small number of predictions genome-wide for mutants in non-reference background
Genome-wide mutation detection aids positional cloning Respiratory growth defect locus localized near centromere on chromosome XVI using S98 array Two candidate SNPs identified in 100kb critical region Deleterious mutation in AEP3 in mutant strain Brauer et al., 2006