Download

1 / 14
140 likes | 232 Views
Kinnon Scott DECPI More Frequent, More Timely and More Comparable Data for Better Results, PREM Week, April 20, 2011. Tracking Change Over Time: Ensuring Comparability. The consequences of not focusing on comparability. Misallocation of resources. Asset Indices: Poorest Quintile Overlap.

E N D
Kinnon Scott DECPI More Frequent, More Timely and More Comparable Data for Better Results, PREM Week, April 20, 2011 Tracking Change Over Time: Ensuring Comparability
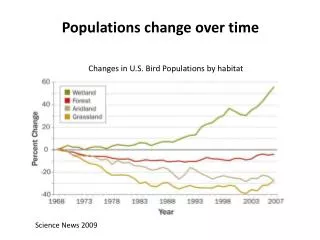
The consequences of not focusing on comparability • Misallocation of resources
Asset Indices: Poorest Quintile Overlap Source: Filmer and Scott, “Assessing Asset Indices” Demographics, forthcoming.
The consequences of not focusing on comparability • Misallocation of resources • Loss of Credibility • Effort to move to empirically based policy making • Undermines all data (whole survey or NSO)
Comparability • Across countries • Income vs. consumption • PPPs • Education levels • Within country at one point in time • Spatial cost of living adjustments • Seasonality (Afghan for example) • Within country over time
It’s not rocket science • Ask the same question • Verbatim • Categories • Change with the changing world • Reference periods • Matters in consumption: collapsing, memory, etc. (Deaton and Grosh, 2000 for overview) • Same time in the year- “Monga” Bangladesh • Fixed reference period in moving survey: Uzbek education • Respondent • Random adult lack of knowledge (Cull and Scott, 2010; Bardasi et al, 2010) • Head of hhlds attitude • Aggregation • More aggregation, lower level, memory issue
Use questions from previous surveys Measuring access to improved water sources in Ghana CWIQ 2003 CENSUS 2000 GLSS 1998 DHS 2003 Examples taken from ADP, Neil Fantom, DECDG
Field Work • Interviewers, supervisors, data entry staff (and tools) all affect data collection • Quality control • Training 2-3 days versus 2-3 weeks • Supervision Administrative vs substantive • Data entry • Ex Post • Concurrent data entry (Glewwe and Dang, 2008) • CAPI (SERPro, 2003; Caeyers, Chalmers and De Weerdt, 2010)
Peru • 2001-2004 Poverty numbers questioned • Did an in-depth review of method of • Questionnaire design • Unit non-response • Item non-response • Imputations • Non-samplingerrors • One of the key issue was decline in supervision and data quality controls in the field • Changes in survey quality changed poverty levels!
How to improve questions? • Add new questions without dropping old • Overlap with new versions-Income Colombia • Experiment with new questions in parallel • Within existing survey (Brazil POF) • At pilot phase (Niger) • Ex post (Malawi)
Summary • Comparability needs to be major focus • Can be affected by all stages of the survey (questionnaire design through field work through imputations for non-response) • Test all changes and overlap series • Check for comparability when using existing data sets