Download
1 / 35
350 likes | 359 Views
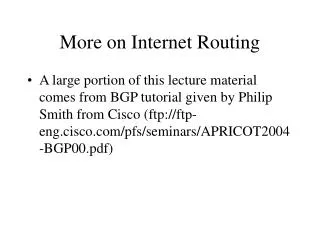
Lecture 15: Measurement Studies on Internet Routing. Lakshminarayanan Subramanian CS 268 class March 10 th , 2004. Internet Routing. Internet organized as a two level hierarchy First level – autonomous systems (AS’s) AS – region of network under a single administrative domain

E N D
Lecture 15: Measurement Studies on Internet Routing Lakshminarayanan Subramanian CS 268 class March 10th, 2004
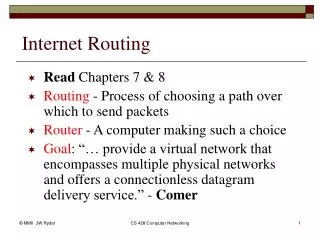
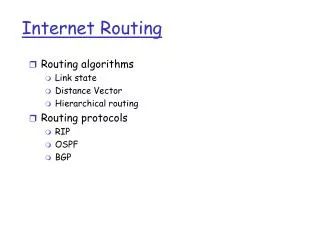
Internet Routing • Internet organized as a two level hierarchy • First level – autonomous systems (AS’s) • AS – region of network under a single administrative domain • AS’s run an intra-domain routing protocols • Distance Vector, e.g., RIP • Link State, e.g., OSPF • Between AS’s runs inter-domain routing protocols, e.g., Border Gateway Routing (BGP) • De facto standard today, BGP-4 istoica@cs.berkeley.edu
Example Interior router BGP router AS-1 AS-3 AS-2 istoica@cs.berkeley.edu
Intra-domain Routing Protocols • Based on unreliable datagram delivery • Distance vector • Routing Information Protocol (RIP), based on Bellman-Ford • Each router periodically exchange reachability information to its neighbors • Minimal communication overhead, but it takes long to converge, i.e., in proportion to the maximum path length • Link state • Open Shortest Path First Protocol (OSPF), based on Dijkstra • Each router periodically floods immediate reachability information to other routers • Fast convergence, but high communication and computation overhead istoica@cs.berkeley.edu
Inter-domain Routing • Use TCP • Border Gateway Protocol (BGP), based on Bellman-Ford path vector • AS’s exchange reachability information through their BGP routers, only when routes change • BGP routing information – a sequence of AS’s indicating the path traversed by a route; next hop • General operations of a BGP router: • Learns multiple paths • Picks best path according to its AS policies • Install best pick in IP forwarding tables istoica@cs.berkeley.edu
End-to-End Routing Behavior in the Internet [Paxson ’95] • Idea: use end-to-end measurements to determine • Route pathologies • Route stability • Route symmetry istoica@cs.berkeley.edu
Methodology • Run Network Probes Daemon (NPD) on a large number of Internet sites Courtesy of Vern Paxson istoica@cs.berkeley.edu
Methodology • Each NPD site periodically measure the route to another NPD site, by using traceroute • Two sets of experiments • D1 – measure each virtual path between two NPD’s with a mean interval of 1-2 days, Nov-Dec 1994 • D2 – measure each virtual path using a bimodal distribution inter-measurement interval, Nov-Dec 1995 • 60% with mean of 2 hours • 40% with mean of 2.75 days • Measurements in D2 were paired • Measure AB and then BA istoica@cs.berkeley.edu
Traceroute Example sky.cs.berkeley.edu whistler.cmcl.cs.cmu.edu istoica@cs.berkeley.edu
Methodology • Links traversed during D1 andD2 Courtesy of Vern Paxson istoica@cs.berkeley.edu
Methodology • Exponential sampling • Unbiased sampling – measures instantaneous signal with equal probability • PASTA principle – Poisson Arrivals See Time Averages • Is data representative? • Argue that sampled AS’s are on half of the Internet routes • Confidence intervals for probability that an event occurs istoica@cs.berkeley.edu
Limitations • Just a small subset of Internet paths • Just two points at a time • Difficult to say why something happened • 5%-8% of time couldn’t connect to NPD’s Introduces bias toward underestimation of the prevalence of network problems istoica@cs.berkeley.edu
Routing Pathologies • Persistent routing loops • Temporary routing loops • Erroneous routing • Connectivity altered mid-stream • Temporary outages (> 30 sec) istoica@cs.berkeley.edu
Routing Loops & Erroneous Routing • Persistent routing loops (10 in D1 and 50 inD2) • Several hours long (e.g., > 10 hours) • Largest: 5 routers • All loops intra-domain • Transient routing loops (2 in D1 and 24 inD2) • Several seconds • Usually occur after outages • Erroneous routing (one in D1) • A route UKUSA goes through Israel • Question: Why do routing loops occur even today? istoica@cs.berkeley.edu
Route Changes • Connectivity change in mid-stream (10 in D1 and 155 inD2) • Route changes during measurements • Recovering bimodal: (1) 100’s msec to seconds; (2) order of minutes • Route fluttering • Rapid route oscillation istoica@cs.berkeley.edu
Example of Route Fluttering Courtesy of Vern Paxson istoica@cs.berkeley.edu
Problems with Fluttering • Path properties difficult to predict • This confuses RTT estimation in TCP, may trigger false retransmission timeouts • Packet reordering • TCP receiver generates DUPACK’s, may trigger spurious fast retransmits • These problems are bad only for a large scale flutter; for localized flutter is usually ok istoica@cs.berkeley.edu
Infrastructure Failures • NPD’s unreachable due to many hops (6 in D2) • Unreachable more than 30 hops • Path length not necessary correlated with distance • 1500 km end-to-end route of 3 hops • 3 km (MIT – Harvard) end-to-end route of 11 hops • Question: Does 3 hops actually mean 3 physical links? • Temporary outages • Multiple probes lost. Most likely due to: • Heavy congestions lasting 10’s of seconds • Temporary lost of connectivity istoica@cs.berkeley.edu
Distribution of Long Outages (> 30 sec) • Geometric distribution Courtesy of Vern Paxson istoica@cs.berkeley.edu
Pathology Summary istoica@cs.berkeley.edu
Routing Stability • Prevalence: likelihood to observe a particular route • Steady state probability that a virtual path at an arbitrary point in time uses a particular route • Conclusion: In general Internet paths are strongly dominated by a single route • Persistence: how long a route remains unchanged • Affects utility of storing state in routers • Conclusion: routing changes occur over a wide range of time scales, i.e., from minutes to days istoica@cs.berkeley.edu
Route Prevalence • I istoica@cs.berkeley.edu
Route Persistence istoica@cs.berkeley.edu
Route Symmetry • 30% of the paths in D1 and 50% in D2 visited different cities • 30% of the paths in D2 visited different AS’s • Problems: • Break assumption that one-way latency is RTT/2 istoica@cs.berkeley.edu
Summary of Paxson’s Findings • Pathologies doubled during 1995 • Asymmetries nearly doubled during 1995 • Paths heavily dominated by a single route • Over 2/3 of Internet paths are reasonable stable (> days). The other 1/3 varies over many time scales istoica@cs.berkeley.edu
End-to-end effects of Path Selection • Goal of study: Quantify and understand the impact of path selection on end-to-end performance • Basic metric • Let X = performance of default path • Let Y = performance of best path • Y-X = cost of using default path • Technical issues • How to find the best path? • How to measure the best path? istoica@cs.berkeley.edu
Approximating the best path • Key Idea • Use end-to-end measurements to extrapolate potential alternate paths • Rough Approach • Measure paths between pairs of hosts • Generate synthetic topology – full NxN mesh • Conservative approximation of best path • Question: Given a selection of N hosts, how crude is this approximation? istoica@cs.berkeley.edu
Methodology • For each pair of end-hosts, calculate: • Average round-trip time • Average loss rate • Average bandwidth • Generate synthetic alternate paths (based on long-term averages) • For each pair of hosts,graph difference between default path and alternate path istoica@cs.berkeley.edu
Courtesy: Stefan Savage istoica@cs.berkeley.edu
Courtesy: Stefan Savage istoica@cs.berkeley.edu
Courtesy: Stefan Savage istoica@cs.berkeley.edu
Courtesy: Stefan Savage istoica@cs.berkeley.edu
Quick Summary of Results • The default path is usually not the best • True for latency, loss rate and bandwidth • Inspite of synthetic end-host transiting • Many alternate paths are much better • Effect stronger during peak hours • This paper motivates overlay routing • Resilient Overlay Networks [Andersen01] • Question: What about herd mentality? istoica@cs.berkeley.edu
Why Path Selection is imperfect? • Technical Reasons • Single path routing • Non-topological route aggregation • Coarse routing metrics (AS_PATH) • Local policy decisions • Economic Reasons • Disincentive to offer transit • Minimal incentive to optimize transit traffic • Question: Enumerate others? istoica@cs.berkeley.edu
Concluding remarks • [Paxson] Internet routing can have several problems due to loops, route fluttering, long outages. • [Savage] Internet routing protocols are not well-tuned for choosing performance optimal paths. • Where does this lead us to? • Possibility 1: Try to redesign a better protocol to fix the problem • Will such an approach ever work? • Possibility 2: Use overlay networks to route around them [RON] • Possibility 3: Reliability is important, but is optimal performance needed? Probably not. istoica@cs.berkeley.edu