Download
1 / 1
10 likes | 107 Views
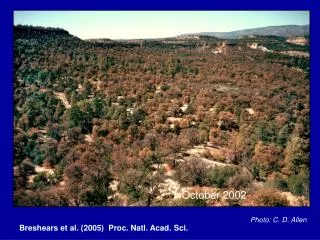
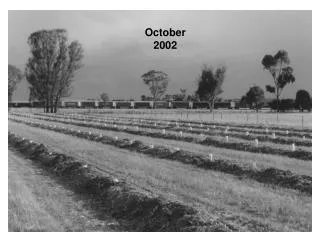
Intraseasonal to interannual zonal displacements of the very oligotrophic waters of the Pacific warm pool: a multi-satellite approach Marie-Hélène Radenac ( marie-helene.radenac@legos.obs-mip.fr ), M. Messié, C. Bosc LEGOS, CNRS-IRD-UPS-CNES, Toulouse, France. November 2001. October 2002.

E N D
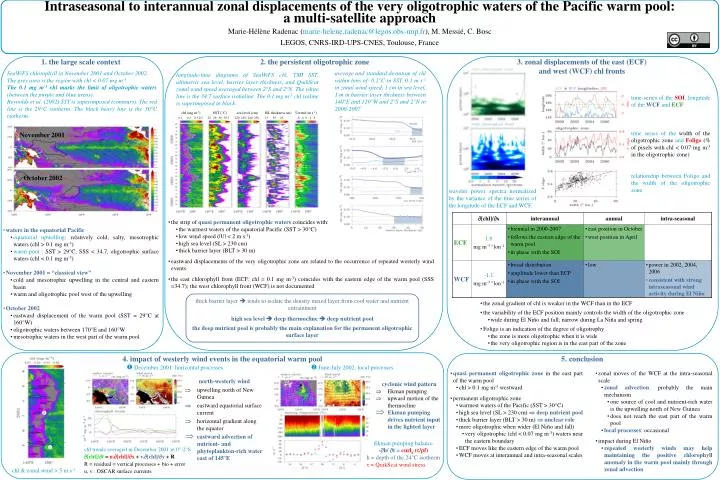
Intraseasonal to interannual zonal displacements of the very oligotrophic waters of the Pacific warm pool: a multi-satellite approach Marie-Hélène Radenac (marie-helene.radenac@legos.obs-mip.fr),M. Messié, C. Bosc LEGOS, CNRS-IRD-UPS-CNES, Toulouse, France November 2001 October 2002 chl (mg m-3) SST (°C) sea level (cm) BL thickness (m)Uwind (m s-1) 0.1 0.2 0.3 0.5 28 29 30 30.5 220 230240250 15 30 45 -8-4 04 8 3. zonal displacements of the east (ECF) and west (WCF) chl fronts 1. the large scale context 2. the persistent oligotrophic zone SeaWiFS chlorophyll in November 2001 and October 2002. The grey area is the region with chl < 0.07 mg m‑3. The 0.1 mg m‑3 chl marks the limit of oligotrophic waters (between the purple and blue areas). Reynolds et al. (2002) SST is superimposed (contours). The red line is the 29°C isotherm. The black heavy line is the 30°C isotherm. average and standard deviation of chl within bins of: 0.1°C in SST, 0.1 m s‑1 in zonal wind speed, 1 cm in sea level, 1 m in barrier layer thickness between 140°E and 120°W and 2°S and 2°N in 2000-2007. longitude-time diagrams of SeaWiFS chl, TMI SST, altimetric sea level, barrier layer thickness, and QuikScat zonal wind speed averaged between 2°S and 2°N. The white line is the 34.7 surface isohaline. The 0.1 mg m‑3 chl isoline is superimposed in black. time-series of the SOI, longitude of the WCF and ECF time series of the width of the oligotrophic zone and Foligo (% of pixels with chl < 0.07 mg m-3 in the oligotrophic zone) relationship between Foligo and the width of the oligotrophic zone. wavelet power spectra normalized by the variance of the time series of the longitude of the ECF and WCF. • the strip of quasi permanent oligotrophic waterscoincides with: • the warmest waters of the equatorial Pacific (SST > 30°C) • low wind speed (|U| < 2 m s-1) • high sea level (SL > 230 cm) • thick barrier layer (BLT > 30 m) • eastward displacements of the very oligotrophic zone are related to the occurrence of repeated westerly wind events • the east chlorophyll front (ECF; chl = 0.1 mg m-3) coincides with the eastern edge of the warm pool (SSS =34.7); the west chlorophyll front (WCF) is not documented • waters in the equatorial Pacific • equatorial upwelling: relatively cold, salty, mesotrophic waters (chl > 0.1 mg m-3) • warm pool : SST > 29°C, SSS < 34.7, oligotrophic surface waters (chl < 0.1 mg m-3) • November 2001 = “classical view” • cold and mesotrophic upwelling in the central and eastern basin • warm and oligotrophic pool west of the upwelling • October 2002 • eastward displacement of the warm pool (SST = 29°C at 160°W) • oligotrophic waters between 170°E and 160°W • mesotrophic waters in the west part of the warm pool thick barrier layer tends to isolate the density mixed layer from cool water and nutrient entrainment high sea level deep thermocline deep nutrient pool the deep nutrient pool is probably the main explanation for the permanent oligotrophic surface layer • the zonal gradient of chl is weaker in the WCF than in the ECF • the variability of the ECF position mainly controls the width of the oligotrophic zone • wide during El Niño and fall; narrow during La Niña and spring • Foligo is an indication of the degree of oligotrophy . • the zone is more oligotrophic when it is wide • the very oligotrophic region is in the east part of the zone 4. impact of westerly wind events in the equatorial warm pool 5. conclusion December 2001: horizontal processes June-July 2002: local processes • quasi permanent oligotrophic zone in the east part of the warm pool • chl > 0.1 mg m-3 westward • permanent oligotrophic zone • warmest waters of the Pacific (SST > 30°C) • high sea level (SL > 230 cm) deep nutrient pool • thick barrier layer (BLT > 30 m) unclear role • more oligotrophic when wider (El Niño and fall) • very oligotrophic (chl < 0.07 mg m-3) waters near the eastern boundary • ECF moves like the eastern edge of the warm pool • WCF moves at interannual and intra-seasonal scales • zonal moves of the WCF at the intra-seasonal scale • zonal advection: probably the main mechanism • one source of cool and nutrient-rich water is the upwelling north of New Guinea • does not reach the east part of the warm pool • local processes: occasional • impact during El Niño • repeated westerly winds may help maintaining the positive chlorophyll anomaly in the warm pool mainly through zonal advection • north-westerly wind • upwelling north of New Guinea • eastward equatorial surface current • horizontal gradient along the equator • eastward advection of nutrient- and phytoplankton-rich water east of 145°E • cyclonic wind pattern • Ekman pumping • upward motion of the thermocline • Ekman pumping drives nutrient input in the lighted layer Ekman pumping balance -h/ t = curlz (/f) h = depth of the 24°C isotherm = QuikScat wind stress chl trends averaged in December 2001 in 0°-2°S [chl]/t= u.[chl]/x+ v.[chl]/y+ R R = residual = vertical processes + bio + error u, v : OSCAR surface currents chl & zonal wind > 5 m s-1