Download
1 / 41
410 likes | 512 Views
US AMLR Program Review. Krill and Krill Predators. Why focus on krill and krill predator relationships. Article II Prevent decrease in size of harvested populations below that necessary for stable recruitment Maintain ecological relationships between harvested, dependent and related species

E N D
US AMLR Program Review Krill and Krill Predators
Why focus on krill and krill predator relationships Article II • Prevent decrease in size of harvested populations below that necessary for stable recruitment • Maintain ecological relationships between harvested, dependent and related species • Prevent or minimize risk of changes not reversible over two or three decades Section C further states: “… taking into account the state of available knowledge of the direct and indirect impacts of harvesting, the effects of introduction of alien species, the effects of associated activities on the marine ecosystem, and the effects of environmental change, with the aim of making possible the sustained conservation of Antarctic marine living resources.” Therefore represents a true ecosystem-based approach to management
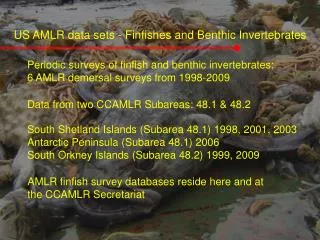
Krill and krill predators – research and management • Assessment and determination of Antarctic krill status and trends (Dependent on ship time) • Monitor krill predator (avian and pinniped) population and reproductive status and trends (field based) • Development of ecosystem-based decision support tools and models to subdivide krill catch. • Assess impacts of environmental change on ability to detect and mitigate fishery effects on krill dependent predators
The US AMLR approach and requirements for advice Krill based fishery advice Acoustic transects General Yield Model Single Acoustic B0 Estimate Acoustic method Integrated Assessment Recruitment index Krill lengths and abundance Trigger level Ecosystem based fishery advice Spatial management Ship-based SSMUs Climate Predator tropho-dynamics Land-based Feedback management Fishery data
Outline • Development of acoustic techniques to estimate population biomass (1991-2005) • Recruitment and krill population dynamics (1980’s to present) • Krill dynamics and feeding ecology of land-based predators (1970s – present) • Development of ecosystem models to subdivide krill catch (2000’s-present) • Climate • Gaps threats and opportunities
Historical commercial catch • Sum of total maximum catch (620 kT) is the trigger level (CM51-01) • Fishery cannot expand past trigger until smaller spatial allocation mechanisms are established. • Desire for ecosystem approach
Development of Acoustic methods to estimate krill population biomass • Huge investment to develop the acoustic method (1991-2005) • Target strength • Species delineation • Biomass of krill is estimated annually for the SSI • Local estimates to examine relationships to land based predators. • Biomass for the Scotia Sea using ACOUSTIC methods • Regionally used to set krill catch limits for fishery. • Acoustic developments affect both!
Part 1 - Acoustic Target Strength Models • Stochastic, Distorted-Wave, Born Approximation (Demer and Conti, 2003) • A physics-based model that takes into account animal length, shape, orientation, and material properties. • Adopted by CCAMLR in 2005 as the new target strength model • Greene et al (1991) • Target strength (TS) is log-linearly related to length of krill and transformed to 120kHz (not based on E. superba) • Was adopted by CCAMLR in 1991 as the international standard for estimating krill biomass • TS120 = -127.45+34.85 log (L) • Used during CCAMLR 2000 Scotia sea wide survey
Part 2 - Species delineation (multi-frequency acoustics) Two frequency (120-38) provides some discrimination with ‘fixed dB differences’ Three frequency provides more discrimination with ‘fixed dB differences’ Information on length ranges (from net tows) allows further discrimination With ‘variable dB differences’ dB differencing
140 120 100 80 Biomass (million tons) 60 40 20 0 Greene SDWBA Var_win Method Implications Differing methods produce different biomass estimates Different assumptions about Target strength Species delineation “acoustic bycatch” For management presents a large problem BUT ultimately the physics-based model is correct How does this impact temporally based modelling
14 12 10 8 Biomass (Million tons) 6 4 2 0 94 96 98 00 02 04 06 08 Year Temporal trends in acoustic biomass Variable dB difference SDWBA model Biomass less than SDWBA Time trends different than SDWBA and Greene Only two large peaks in biomass (1996 and 2003) SDWBA Var. window Greene
How do we choose? Greene and SDWBA models differ from windowed technique SDWBA and Greene do NOT correlate with net tow data Windowed technique correlated (r=0.67) with net tow data Caveat: we use length data from nets to develop variable dB windows Density (no 1000m^-3) Biomass (tons) Year
Scotia Sea Drake Passage ACC Latitude Antarctic Peninsula Weddell Sea Longitude Krill abundance patterns Annual surveys provide context to examine temporal patterns abundance recruitment Expanded to include surrounding areas Several basic findings from AMLR studies
2002 1992 1989 1996 1990 1993 1997 1998 1991 1994 1995 1999 2000 2001 Krill cohorts are obvious in time series 1988 year class 1991 year class 1995 year class 2001 year class Loeb and Siegel (1995)
Relationships to the environment Recruitment associated with ice dynamics Temporal abundance lags recruitment Sea ice declines ENSO variability starting dominate (see Loeb et al. 2009). Do we capture these dynamics in upper trophic levels?
Future research • Simple biomass estimates insufficient • estimate is old (2000 survey) • estimates vary by method • Estimates Do not incorporate climate change • Must incorporate other data • Net and acoustic time series • US and other nations • Fishery data • Predator consumption and effort • Integrated assessment • Ecosystem approach 140 120 100 Biomass (million tons) 80 60 40 20 0 Greene SDWBA Var_win Method
Outline • Development of acoustic techniques to estimate population biomass (1990-2005) • Recruitment and krill population dynamics (1980’s to present) • Krill dynamics and feeding ecology of land-based predators (1970s – present) • Development of ecosystem models to subdivide krill catch (2004-present) • Climate • Gaps threats and opportunities
Linking avian, pinniped and krill relationships: building integrated models Feeding ecology Recruitment Population trends Scotia Sea Drake Passage ACC Latitude Antarctic Peninsula Weddell Sea Longitude
2002 2003 2003 2004 2004 2005 2005 2006 2006 <16 21-25 31-35 41-45 51-55 20 25 30 35 40 45 50 55 60 15 Krill length from diet of Adelie and Chinstrap penguins at KGI and fur seals at Livingston Island Penguins Fur Seal Penguins and fur seals exhibit similar diet patterns Show progression of population ageing in krill cohort? Similar on both KGI and Livingston Islands Index of recruitment for integrated assessment?
60 50 Mean Krill Length (mm) 40 30 20 98 99 00 01 02 03 04 05 06 Year Do diets track prey field? Fur seals 60 Net tow data reveal fluctuations in mean size of krill Penguins and fur seals track changes in the prey field, but selectivity functions differ. Implications for energetics of upper trophic levels 50 Length (mm) 40 30 Chinstrap penguin Nets
100% 75% 50% 25% 0% 100% 75% 50% 25% 0% 1998 1999 2000 2001 2002 2003 2004 2005 2006 Comparison of krill from diets and net Chinstrap Fur Seal penguins JUVENILE MALE FEMALE 100% 90% 80% 70% 60% 50% Nets 40% 30% 20% 10% 0% 2002 2003 2004 2005 2006 2007 2008 2000 2001 2002 2003 2004 2005 2006 2007 2008 2009
60% 8.0 04 7.0 03 02 40% 6.0 y = -0.3918x + 22.04 Mean trip duration (d) %Overnight foraging trips 07 05 2 R = 0.7104 20% 5.0 y = -0.03x + 181 R2 = 0.95 06 4.0 0% 3.0 50% 2.0 03 04 02 40.0 45.0 50.0 55.0 40% 05 Mean krill length in fur seal diet 07 30% (mm) 06 % Time spent foraging 20% y = -0.02x + 1.08 2 R = 0.94 10% 0% 35 40 45 50 55 Krill length (mm) Foraging durations among species Foraging duration inversely proportional to krill biomass Foraging duration inversely related to krill size Foraging patterns consistent among species How to examine spatial use and energy maximization? Effort as a measure of krill abundance? Utility in an integrated assessment
Krill length from 60 chinstrap penguin diet 50 40 30 Ice Index 3 Krill Biomass 2 1 0 -1 -2 -3 1997 1998 1999 2000 2001 2002 2003 2004 2005 2006 2007 2008 Diets, biomass and demography are linked Krill biomass related to ice lagged 1 year Krill length inversely related to biomass Seal and penguins diets track abundance and recruitment of krill
Outline • Development of acoustic techniques to estimate population biomass (1990-2005) • Recruitment and krill population dynamics (1980’s to present) • Krill dynamics and feeding ecology of land-based predators (1970s – present) • Development of ecosystem models to subdivide krill catch (2004-present) • Climate • Gaps threats and opportunities
Penguins Fur Seals 62.0 2001 62.5 63.0 Latitude 62.0 2002 62.5 63.0 61.5 61.0 60.5 60.0 59.5 Longitude Predators exhibit restricted summer foraging areas Different effort in different years Most activity between 62 and 62.5 degrees south
50 52 54 56 e d u t i t a 58 L Fishery around islands Catch (t) 60 48.3 0 to 100 100 to 1000 62 1000 to 10000 10000 to 100000 100000 to 300100 64 41 70 65 60 55 50 45 40 35 30 25 20 Longitude 48.1 60.0 48.4 48.2 60.5 48.5 Size Cluster 3 61.0 1000 61.5 900 e d U.S. observers on krill vessels 800 u Size Cluster 2 t 62.0 i t 700 a L 600 62.5 500 400 63.0 300 200 63.5 100 0 64.0 63 62 61 60 59 58 57 56 55 54 53 Longitude Krill fishery overlaps feeding habitat
Proximity of fishing and foraging to breeding colonies Predator and fishery overlap define the minimal separation distances Distance from colony can define management units
Allocating catch to Small-Scale Management Units • Concentration of catches near large colonies of land-breeding krill predators • Established SSMUs by considering common patterns among krill distribution, predator foraging areas and krill fishing grounds • Allocate precautionary catch limit among SSMUs • Spatial basis for revised krill management procedure
Ecosystem observations form basis of ecosystem – based fishery models Ecological data can inform the development of models for the spatial allocation of krill Provide data to assess risks Provide data to infer environmental forcing for inclusion in models
The US AMLR approach and requirements for advice Krill based fishery advice Acoustic transects General Yield Model Single Acoustic B0 Estimate Integrated Assessment Recruitment index Trigger level Krill abundance Ecosystem based fishery advice Spatial management Ship-based Predator tropho-dynamics SSMUs Climate Land-based Feedback management Fishery data
Outline • Development of acoustic techniques to estimate population biomass (1990-2005) • Recruitment and krill population dynamics (1980’s to present) • Krill dynamics and feeding ecology of land-based predators (1970s – present) • Development of ecosystem models to subdivide krill catch (2004-present) • Climate • Gaps threats and opportunities
6 Meridional 5 Zonal SO Index 4 3 2 1 Wind speed 0 -1 -2 3 -3 29 -4 1940 1950 1960 1970 1980 1990 2000 2010 2020 1 28 Year -1 27 El Nino 3.4 -3 26 -5 25 1975 1980 1985 1990 1995 2000 2005 2010 Year Climate change impacts are varied
Population size Recruitment rate 1 12000 0.9 0.8 10000 0.7 8000 0.6 Proportion of bands returning 0.5 Number of nests 6000 0.4 4000 0.3 0.2 2000 0.1 0 0 1975 1980 1985 1990 1995 2000 2005 2010 1975 1980 1985 1990 1995 2000 2005 2010 Year Year of release 1 12000 0.9 0.8 10000 0.7 8000 0.6 0.5 Proportion of bands returning Number of nests 6000 0.4 0.3 4000 0.2 2000 0.1 0 0 1975 1980 1985 1990 1995 2000 2005 2010 1975 1980 1985 1990 1995 2000 2005 2010 Year of release Year Population trends vary by species Adelie Penguins 1981 -2008 Gentoo Penguins 1981 -2008
POPULATION (NUMBER of NESTS) Penguin population size in relation to sea ice extent • Initial correlation with sea ice • Large decline beginning 1990 • No correlation since late 1990s • Other factors (top down) impacting populations? 12000 3 Ice index Adelie 2 10000 1 8000 0 6000 -1 4000 -2 2000 -3 0 -4 1978 1982 1986 1990 1994 1998 2002 2006 Year
Antarctic fur seal production Pup production across SSI has leveled since late 1990s Pup production at Cape Shirreff has been steady What factors limiting population growth and pup production?
1000 100 Krill Density (no. m^2) 10 Atkinson et al. (2004) 1 1976 1980 1984 1988 1992 1996 2000 2004 Historical commercial catch Global compilation of data (40% AMLR) used to show that krill have declined by 80% decline correlated to sea-ice decline (Atkinson et al. 2004) Over same period predator production stable or declining Fishery is poised to expand; less ice has increased the length seasonal fisheries in some historically summer fishery areas Weaning seal pups and fledging chicks have little experience to find food (increased post weaning/fledging mortality)?
Expansion and Climate Change One survey only Surveys every 2 yrs 0.8 proportion of years fishes not “depleted” 0.4 0.0 0.0 0.4 0.8 catch as fraction of allocation Allocate using [demand – krill biomass] (with climate change) With climate change (trends in environment or population) monitoring becomes more important Monitoring based feedback management to allocate catch Results of our modeling efforts show that INCREASED not DECREASED monitoring is necessary
Little knowledge of meso- and pelagic fish; critical for ecosystem modeling and allocation decisions 40 30 Consumption 20 10 0 mammals fish Gaps, threats, and opportunities • Climate change is rapid in SSI, loss of shiptime threatens maintenance of time series during most critical time of change – lack testing of ecosystem based krill allocation • Lack of overwinter data critical to predicting recruitment of upper level predators – especially first weeks post fledging / weaning • Greater integration with outside programs to meet goals and needs
Trigger Questions 1 • Is the current approach sufficient? What should be expanded? What should be de-emphasized? • Single biomass as an estimate of krill biomass in assessment? • Integrated assessment using other data (new stock assessment FTP)? • Modeling studies have not produced agreement – focus on data? • No significant pelagic fish studies? • No growth or energetic studies of krill? • How should the AERD balance the collection of time-series data with project-based studies? • Have we made efficient use in the balance; loss of ship days and third leg.
Trigger Questions 2 • Are the AMLR survey areas and study taxa appropriate given the likely impacts of climate change? • Increase monitoring in Weddell Sea (cameras and counts; krill and productivity)? • Dynamics of other euphausiids; phytoplankton community; nutrient and elemental fluxes? • What specific aspects of climate change should be the focus of future research? • Develop expertise in numerical physical modeling? • Incorporate current data collection into IPCC or other climate programs? • Increase commitment to other high visibility topics (OA)?
Autnomous surveys in difficult areas Quadrocopters • GPS equipped • Camera borne • Programmable • Lightweight • Battery powered • Extremely quiet • Level compensating • Collision safe • Short missions