Download
1 / 55
550 likes | 564 Views
PRECIPITATION Dr. Sam Miller Weather & Climate – MTDI 1200OL Plymouth State University. 1. Ahrens, Ch. 5. When a cloud formation process is pushed even further, individual cloud droplets or ice crystals grow to the point where they are no longer held aloft by buoyancy and air currents

E N D
PRECIPITATION Dr. Sam Miller Weather & Climate – MTDI 1200OL Plymouth State University 1
When a cloud formation process is pushed even further, individual cloud droplets or ice crystals grow to the point where they are no longer held aloft by buoyancy and air currents • Precipitation develops • Type and character of precipitation is dependent on many variables
Showery Precipitation • “Showery” means rapid variations in intensity • Individual drops usually larger than those falling from stratiform clouds • Relatively short duration (mins – hrs) • Occurs with cumuliform clouds • Cumulonimbus (thunderstorms) • Towering cumulus (rain or snow showers)
TCu CB [mixed liquid and solid] [rain]
Showery Precipitation • Hail occurs when precipitation particle is recycled through a series of updrafts and downdrafts • Remains above freezing level for a long time, accreting more and more ice • Hail formation process
Current record holder • Aurora, Nebraska (June 2003) • 7 inches diameter • 18.75 in circumference
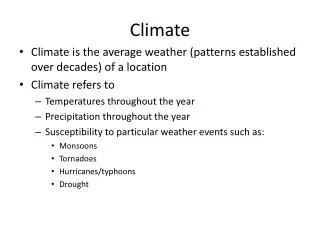
Continuous Precipitation • “Continuous” means relatively steady intensity • May slowly vary in intensity • May be intermittent • Individual drops usually smaller than those falling from cumuliform clouds • May be of very long duration (hrs – days)
Continuous Precipitation • Occurs with stratiform clouds • Nimbostratus • Dense altostratus • Phase reaching ground depends on vertical temperature profile • During formation • During descent to ground
NS NS
Snow • Air temperature is below freezing throughout the vertical column
Sleet (Ice Pellets) • Air temperature above freezing in shallow layer aloft • Partially or completely melts falling snow • Result is usually wet snow in warm layer • Deep layer in contact with surface is below freezing • Precipitation particle refreezes into a hard ball of ice before reaching ground
Freezing Rain • Air temperature above freezing in deeper layer aloft • Completely melts falling snow • Result is rain in warm layer • Shallow layer in contact with surface is below freezing • Precipitation particle does not refreeze until striking Earth’s surface
Rain • Air temperature is below freezing at higher altitude, but warms to above freezing. • Snow melts before reaching surface
Practice A C D B
Direct In Situ Measurements • Rain Gauge • Instrument that measures the amount of rain that falls in a certain time interval • Measured in inches • mm in rest of the world
Direct In Situ Measurements • Rain Gauge • Instrument that measures the amount of rain that falls in a certain time interval • Measured in inches • mm in rest of the world 10:1 funnel and inner measuring tube improves accuracy of measurements Removed during snow season
In Situ Rain Gauge • Standard stick gauge • Not always made of plastic • This is a “consumer” grade gauge • Professional grade gauges usually made of sheet metal
In Situ Rain Gauge • Automatic tipping bucket gauge • Measures in increments of 0.01 inches • Some are heated
In Situ Snow Gauge • Attempts to compensate for wind problem • Can also add rings of fencing that attempt to slow the wind and make the snow fall straight down
Wind Problem • Precipitation often does not fall straight down • Wind speeds of 10 mph or higher • Significant problem with SNOW • Fencing doesn’t help much • Falling precipitation is often undersampled, by as much as 50 percent
Sample Size Problem • Adding up area of sampling of all the “official” rain gauges in the CONUS would amount to the size of a baseball infield • This tiny area is used to represent the measured precipitation amount in the entire CONUS
Sample Size Problem • Remote sensing (non in situ) helps to alleviate this problem
Remote Sensing of Precip • RADAR – RAdio Detection And Ranging • Electronic instrument used to detect objects (such as falling precipitation) • Precipitation scatters microwaves • Part of EM spectrum with wavelengths longer than infra-red • Radar antenna emits microwaves and listens for the portion of the signal scattered back by rain and other types of precipitation • Scans radius of about 150 miles around radar antenna
Weather Radar CURRENT GENERATION OF RADAR IS CALLED WSR-88D WEATHER SURVEILLANCE RADAR 1988 DOPPLER FULLY AUTOMATED COMPUTER CONTROLLED
RADAR OPERATION • Pulse transmitted every few microseconds • Transmitted power 750 kW • Wavelength is 10 cm
RADAR OPERATION • Pulse transmitted every few microseconds • Transmitted power 750 kW • Wavelength is 10 cm • Small percentage scattered back from water droplets, snowflakes, and ice crystals • Returned power << 750 kW • Amplified by radar’s internal electronics
RADAR OPERATION • Volume Control Pattern (VCP) • Several antenna elevation angles used • Range bins along given radial at ¼ km intervals RADAR DISH
RADAR OPERATION • Images assembled from reflectivity on each elevation angle 0.5 deg 1.5 deg 2.4 deg 3.4 deg
RADAR OPERATION • Significant processing to create derived products • One-hour precipitation total • Three-hour precipitation total • Storm-total precipitation • Movement of individual storm cells • Total amount of liquid water present in each range bin • Likelihood of hail, and maximum hail size with each storm cell • Mesocyclones and tornadic vortex signatures • Others • Automated tracking of tornado-related features
Northern NH has Radar coverage by facilities at NWS weather offices in: • Burlington, Vermont • Gray, Maine • Taunton, Massachusetts • Albany, New York
INTERPRETING REFLECTIVITY IMAGES Reflectivity Scale (Powers of 10)
INTERPRETING REFLECTIVITY IMAGES Radar antenna is here
INTERPRETING REFLECTIVITY IMAGES Some echoes near antenna are “ground clutter”
INTERPRETING REFLECTIVITY IMAGES Most echoes are not ground clutter Color coding indicates reflectivity in dBZ Reflectivity primarily from precipitation-sized particles Cloud droplets usually too small to be detected by radar
DATA FROM ALL 135 CONUS RADARS CAN BE ASSEMBLED INTO A SINGLE IMAGE
There are many problems with radar data: • Data are subject to contamination from ground clutter and other sources • Spatial resolution gets worse with increasing distance from the radar dish • The relationship between reflectivity and the amount of precipitation present is based on a series of assumptions • Many of the other derived products are based on poor assumptions