Download
1 / 35
350 likes | 598 Views
Multiple Indicator Cluster Surveys Data Interpretation, Further Analysis and Dissemination Workshop. Approaches to using MICS for Equity/Poverty Analysis. Multidimensional Poverty Indices. Outline Consumption/income poverty Wealth Index Bristol Child Deprivation Index

E N D
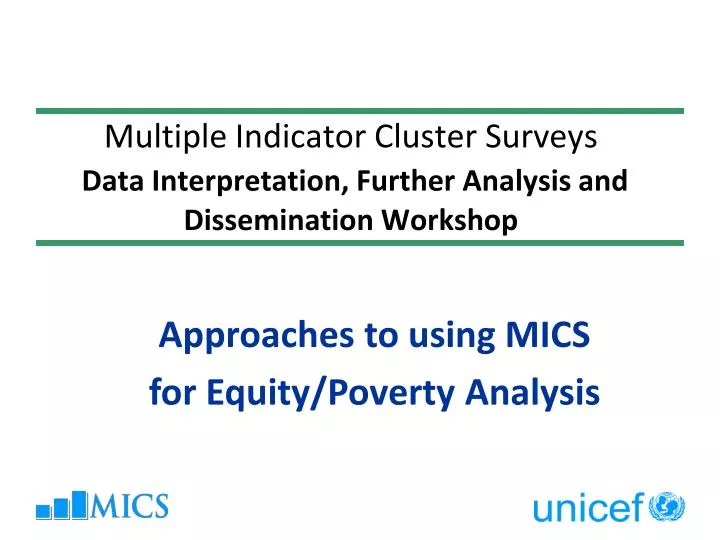
Multiple Indicator Cluster SurveysData Interpretation, Further Analysis and Dissemination Workshop Approaches to using MICS for Equity/Poverty Analysis
Multidimensional Poverty Indices Outline Consumption/income poverty Wealth Index Bristol Child Deprivation Index Multidimensional Poverty Index (MPI) New Contribution (MODA) Critics Examples
Multidimensional Poverty Indices -Background Once upon a time… ….INCOME/CONSUMPTION POVERTY Three main decisions: 1. How do we assess individual well-being or "welfare"? Income or consumption 2. At what level of measured well-being do we say that a person is not poor? Choose poverty lines 3. How do we aggregate individual indicators of well-being into a measure of poverty? Foster-Greer-Thorbecke (FGT) poverty measures
Multidimensional Poverty Indices - Background “Children living in poverty are deprived of nutrition, water and sanitation facilities, access to basic health care services, shelter, education, participation and protection, and that while a severe lack of goods and services hurts every human being, it is most threatening and harmful to children, leaving them unable to enjoy their rights, to reach their full potential and to participate as full members of the society” UN General Assembly Definition of Child Poverty, 10th January 2007
Multidimensional Poverty IndicesWEALTH INDEX • Use information on assets or household possessions It takes a large number of assets that may not tell us much individually, but are correlated since they are all related to an underlying factor – in this case, “wealth” • Generate weights (factor scores) for each of the assets through principal components analysis
Multidimensional Poverty IndicesWEALTH INDEX • Weights summed by household, household members ranked according to the total score of the household in which they reside • Run for urban and rural separately. Regressions used to combine. • Divide the households into quintiles.
Multidimensional Poverty IndicesWEALTH INDEX • Watch • Bicycle • Motorcycle/scooter • Animal-drawn cart • Car/truck • Boat • Source of drinking water • Type of sanitation facility • Ownership of animals • Ownership of land • Furniture • Additional household items • Number of persons per sleeping room • Material of dwelling floor • Material of the roof • Material of the walls • Fuel used for cooking • Electricity • Radio • Television • Mobile telephone • Non-mobile telephone • Refrigerator
Multidimensional Poverty IndicesWEALTH INDEX • Long-term wealth versus current economic status • Adjustment for household size? • How to deal with public services? Does the asset index reflect community variables (especially locally available infrastructure such as electricity for lighting or piped water) rather than household specific variables? • Urban bias • Strength of the index when comparing it over time and across countries
Multidimensional Poverty IndicesWEALTH INDEX New contributions: Approaches for Urban and Rural Areas (DHS, 2008) Comparative Wealth Index (DHS, 2014)
Multidimensional Poverty Indices BRISTOL POVERTY MEASURE Developed by Bristol University - Townsend Centre for International PovertyResearchwith UNICEF UNICEF launched at the end of 2007 the Global Study on Child Poverty and Disparities that combines the income approach with the Bristol deprivations approach (see http://www.unicefglobalstudy.blogspot.com/) More than 50 UNICEF Country Offices in seven regions have joined the study. More than 25 country reports have been produced
Multidimensional Poverty Indices • Children experiencing TWO OR MORE severe deprivations are absolute poor • Children experiencing ONE OR MORE severe deprivations are severely deprived • 34% of children in the developing world (around 650 million) live in absolute poverty • 56% of children in the developing world (over one billion) experience severe deprivation of at least one basic human need
Multidimensional Poverty Indices Multidimensional Poverty Index (MPI) Developedby Oxford Poverty & HumanDevelopmentInitiative (Sabina Alkire and James Foster 2007, 2009) UnitedNationsDevelopmentProgramme Human DevelopmentReport 2013: 104 countries (30 basedon MICS)
Multidimensional Poverty Indices Each dimension is equally weighted: • Health = 1/3 • Education = 1/3 • Standard of Living = 1/3 • The MPI combines two aspects of poverty: • MPI = H x A • Incidence (H) = the percentage of people who are poor, or the headcount • Intensity (A) of people’s poverty = the average and weighted percentage indicators in which poor people are deprived
Multidimensional Poverty Indices Weighted count of deprivation in household 1: Headcount ratio= (80 percent of people live in poor households) Intensity of poverty= (the average poor person is deprived in 56 percent of the weighted indicators) MPI= H × A = 0.45
Multidimensional Poverty Indices • Results: 1.7 billion people, 32% of the total population in 104 countries, are identified as multi-dimensionally poor. 51% live in South Asia and 28% in sub-Saharan Africa
Countries with the highest incidence of poverty tend to have the highest intensity of poverty.
Multidimensional Poverty Indices • Deprivation in living standards (the green portion) often contributes more than deprivation in either of the other two dimensions. • In most countries, the second biggest contribution comes from educational deprivations.
Multidimensional Poverty Indices MPI and Income Poverty are related PEARSON CORR. $ 1.25/day – MPI = 0.85 More peopleare MPI poorthanincomepoor (slightlyless at $2/day)
Multidimensional Poverty Indices New contribution: Multiple Overlapping Deprivation Analysis (MODA) IRC/UNICEF Child is unit of analysis Life-cycle approach Building further on the rights-based approach of Bristol and the methodology used for the MPI Adding focus on overlaps, intensity of deprivation CC-MODA vs. N-MODA
Multidimensional Poverty Indices Multidimensional indices complement traditional analysis Critique (Ravalliona.o. 2010-2013) Indicators likely to be correlated with consumption or income, but they would not capture well the impacts on poor people of economic downturns or shocks. As data is to be collected from the same survey, the precise indicators used in the MPI are somehow data driven and source dependant. Indices adding up “apples and oranges” …how can one contend that the death of a child is equivalent to having a dirt floor, cooking with wood, and not having a radio, TV, telephone, bike or car? Or that attaining these material conditions is equivalent to an extra year of schooling or to not having any malnourished family member? Death in family does not work when a mother has died – extreme vulnerability. Malnourishment does not capture death. Isn’t “multi-dimensional” about recognizing that there are important aspects of welfare that cannot be captured in a single index (a “Mashup Index”)?
References Alkire, S. and Foster, J. 2007 and 2009. Countingand Multidimensional PovertyMeasurement. OPHI WorkingPaper 7 and 32. Alkire, S. and Santos, M.E. 2010. Acute Multidimensional Poverty: A New IndexforDevelopingCountries. OPHI WorkingPaper 38. Gordon, David, et al., Childpoverty in thedevelopingworld, ThePolicyPress, Bristol, UK, October 2003. Ravallion, Martin, MashupIndices of Development(September, 2010). World Bank PolicyResearchWorkingPaper Series, 5432, 2010. Ravallion, Martin, On Multidimensional Indices of Poverty (February, 2011). World Bank PolicyResearchWorkingPaperSeries, 5580, 2011. Rutstein, Shea O. and Kiersten Johnson. 2004. The DHS WealthIndex. DHS ComparativeReports No. 6. Calverton, Maryland: ORC Macro. Rutstein, Shea O. 2008. The DHS WealthIndex: Approachesfor Rural and UrbanAreas de Neubourg et al. 2012. Cross-Country MODA Study,Technical note, Multiple OverlappingDeprivationAnalysis (MODA). de Neubourg et al. 2012. Step-by-step guidelines to the Multiple OverlappingDeprivationAnalysis (MODA). UNICEF Office of ResearchWorkingPaper 2012-10.
What about MICS? • Syntax developed for • Bristol (with necessary modifications) • MPI • Both to undergo a last review • Syntax under development for • MODA • Can be shared with MICS countries very soon – not for Final Reports, but for further analysis