Download
1 / 17
170 likes | 171 Views
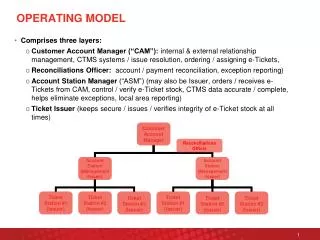
SEA FISHERIES INSITUTE. 1. Cod assessment and management with production models 2. Biological Operating Model: Cod assessment model with fit to survey estimates of total mortality by Jan Horbowy Sea Fisheries Institute, Gdynia, Poland. EFIMAS Baltic cod CS meeting Copenhagen,

E N D
SEA FISHERIES INSITUTE 1. Cod assessment and management with production models 2. Biological Operating Model: Cod assessment model with fit to survey estimates of total mortality by Jan Horbowy Sea Fisheries Institute, Gdynia, Poland EFIMAS Baltic cod CS meetingCopenhagen, 19 January, 2007
SEA FISHERIES INSITUTE Production and Difference Models Models tested Schaefer model (1954) B -biomass, t – time, q - catchability, f - fishing effort, B∞ -carrying capacity, r- growth rate, n – shape parameter, v, h, k - growth parameters, w – average weight, R - recruitment Fox model (1970) Pella and Tomlinson model (1969) Difference model, Horbowy (1992)
SEA FISHERIES INSITUTE Fitting the models • Two options for fishing effort: • F from XSA • Effort on the basis of commercial fishery data (Poland, Denmark, Sweden, Latvia) • Effort estimates • Ln(CPUE) = country + year + quarter + area + gear + vessel_size + + error(NegativeBinomial) • effort = catch/antilog(year_effect) • - 36% of deviance explained • - good correlation of standardised effort with F-XSA(R of ca. 0.9) • Parameter estimation by minimization of:
SEA FISHERIES INSITUTE Biomass estimates, Schaefer modelXSA F taken as effort MSY=230,000 t. B∞=1,200,000 t. F-MSY=0.38
SEA FISHERIES INSITUTE Biomass estimates, difference model fit with commercial effort data For fit to effort as XSA fishing mortality: - SS < SS in Schaefer, - better retro (much lower CV of consecutive retro estimates)
SEA FISHERIES INSITUTE Other models Other models Fox model - fits badly - very strong trends in residuals: positive till 1991, negative for next years - MSY=130,000 tons, Fmsy=0.33 Pella & Tomlinson Model - fit depends on starting values, probably local minima - estimates of parameters totally unrealistic Difference model with F-XSA as effort - fits well - SS < SS in Schaefer, better retro (much lower CV of consecutive retro estimates)
SEA FISHERIES INSITUTE Conclusions 1 • the Schaefer & Difference model estimates are very close to the XSA estimates when effort taken as XSA fish. mort. • fits of the models with effort from commercial fleet only slightly worse • retrospective patterns acceptable
SEA FISHERIES INSITUTE Retrospective prediction of status quo catches
SEA FISHERIES INSITUTE Retrospective predicttion of status quo biomass
SEA FISHERIES INSITUTE Conclusions 2 Table 1. Mean relative difference between predicted and observed biomass and catches for Schaefer and Difference models and ICES predictions • retrospective predictions of status quo biomass and catches by Schaefer & Difference models are similar to (slightly better than) the ICES predictions (realised catches and biomass taken as reference)
SEA FISHERIES INSITUTE BIOLOGICAL OPERATING MODEL (BOM) Cod assessment & simulation model with fit to survey estimates of total mortality
SEA FISHERIES INSITUTE Three basic data problems for Baltic cod • substantial underreporting of catches • inconsistencies in age reading • change of survey design and gear (2001) To overcome last point: • an age-structured, integrated assessment model is developed • the model is fitted to total mortality, Z, estimated from survey, instead of to survey CPUE
SEA FISHERIES INSITUTE The model backward simulations: classical VPA equations and the separability assumption Baranov catch equation separability assumption survey index proportional to stock size
SEA FISHERIES INSITUTE Fitting the model If survey catchability is age & year independent then: Parameter estimation by minimization of: λ = weighting factor, the ratio of catch variance along the fitted model to survey variance.
800 1.6 SSB-model 1.4 700 SSB-WGBFAS 1.2 600 1.0 500 F(4-7) 0.8 SSB (thous. tons) 400 0.6 300 0.4 200 F(4-7)-model 0.2 F(4-7) - WGBFAS 100 0.0 0 1980 1982 1984 1986 1988 1990 1992 1994 1996 1998 2000 2002 2004 1980 1982 1984 1986 1988 1990 1992 1994 1996 1998 2000 2002 2004 Fig. 2. The spawning stock biomass and average fishing mortality (ages 4-7) estimated by the model and ICES (2004 SEA FISHERIES INSITUTE BOM: SSB and fishing mortality estimates • The CVs (bootstrap) • biomass: 6-8% for 1980-2002 and 16% for 2003. • fishing mortality: 8 to 12% for 1980-2002 and 19% for 2003. • selectivity: 20 to 30%
SEA FISHERIES INSITUTE BOM: Retrospective analysis, SSB • all survey data • b. survey Z in 2000-2001 excluded
SEA FISHERIES INSITUTE Conclusions 3 BIOLOGICAL OPERATING MODEL • the model estimates are very close to the XSA estimates (ICES 2004) with shrinkage SE of 0.5 • increase in survey estimates of stock size in recent years is more effect of changing gear and survey design than the improvement in stock size • XSA assessment (ICES 2004) with option for shrinkage SE of 0.5 was probably more realistic than the option with SE of 0.75.