Download
1 / 40
400 likes | 426 Views
Process Modeling. System Analysis & Design Course Sharif University of Technology MohammadAmin Fazli. Models: Logical and Physical. Model – a pictorial representation of reality. Just as a picture is worth a thousand words, most models are pictorial representations of reality.

E N D
Process Modeling System Analysis & Design Course Sharif University of Technology MohammadAmin Fazli
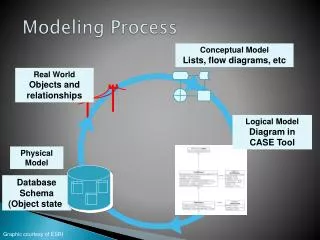
Models: Logical and Physical Model – a pictorial representation of reality. Just as a picture is worth a thousand words, most models are pictorial representations of reality. Logical model – a nontechnical pictorial representation that depicts what a system is or does. Synonyms or essential model, conceptual model, and business model. Physical model – a technical pictorial representation that depicts what a system is or does and how the system is implemented. Synonyms are implementation model and technical model.
Why Logical System Models • Logical models remove biases that are the result of the way the system is currently implemented, or the way that any one person thinks the system might be implemented. • Logical models reduce the risk of missing business requirements because we are too preoccupied with technical results. • Logical models allow us to communicate with end-users in nontechnical or less technical languages.
Process Modeling Process modeling – a technique used to organize and document a system’s processes. • Flow of data through processes • Logic • Policies • Procedures
Simple Data Flow Diagram Data flow diagram (DFD) – a process model used to depict the flow of data through a system and the work or processing performed by the system. Synonyms are bubble chart, transformation graph, and process model.
Differences Between DFDs and Flowcharts • Processes on DFDs can operate in parallel (at-the-same-time) • Processes on flowcharts execute one at a time • DFDs show the flow of data through a system • Flowcharts show the flow of control (sequence and transfer of control) • Processes on a DFD can have dramatically different timing (daily, weekly, on demand) • Processes on flowcharts are part of a single program with consistent timing
Activity Diagram • Activity diagrams are used for • documenting existing process • analyzing new Process Concepts • finding reengineering opportunities. • The diagrams describe the state of activities by showing the sequence of activities performed. • they can show activities that are conditional or parallel.
Activity Diagram Concepts • An activity is trigged by one or more events and activity may result in one or more events that may trigger other activity or processes. • Events start from start symbol and end with finish marker having activities in between connected by events. • The activity diagram represents the decisions, iterations and parallel/random behavior of the processing. • They capture actions performed. • They stress on work performed in operations (methods).
When to Use Activity Diagrams • The main reason to use activity diagrams is to model the workflow behind the system being designed. • Activity Diagrams are also useful for: • analyzing a use case by describing what actions need to take place and when they should occur • describing a complicated sequential algorithm • modeling applications with parallel processes • Activity Diagrams should not take the place ofinteraction diagrams and state diagrams. • Activity diagrams do not give detail about how objects behave or how objects collaborate.
Components • An activity is an ongoing, though interruptible, execution of a step in a workflow (such as an operation or transaction) • Represented with a rounded rectangle. • Text in the activity box should represent an activity (verb phrase in present tense).
Components • An event is triggered by an activity. It specifies a significant occurrence that has a location in time and space. • An instance of an event (trigger) results in the flow from one activity to another. • These are represented by directed straight lines emerging from triggering activity and ending at activity to be triggered. Label text for events should represent event but not the data involved. • A decision may be shown by labeling multiple output transitions of an activity with different guard conditions. • For convenience a stereotype is provided for a decision: the traditional diamond shape, with one or more incoming arrows and with two or more outgoing arrows, each labeled by a distinct guard condition with no event trigger.
How to Draw an Activity Diagram • Diagrams are read from top to bottom and have branches and forks to describe conditions and parallel activities. • A fork is used when multiple activities are occurring at the same time. • A branch describes what activities will take place based on a set of conditions. • All branches at some point are followed by a merge to indicate the end of the conditional behavior started by that branch. • After the merge all of the parallel activities must be combined by a join before transitioning into the final activity state.
Activity Diagram Example Start State Activity Fork Branch Join Merge End State
Use Case • Withdraw money from a bank account through an ATM
Process Decomposition Decomposition – the act of breaking a system into sub-components. Each level of abstraction reveals more or less detail.
Decomposition Diagrams Decomposition diagram – a tool used to depict the decomposition of a system. Also called hierarchy chart.
Types of Logical Processes Function – a set of related and ongoing activities of a business. • A function has no start or end. Event – a logical unit of work that must be completed as a whole. Sometimes called a transaction. • Triggered by a discrete input and is completed when process has responded with appropriate outputs. • Functions consist of processes that respond to events. Elementary process – a discrete, detailed activity or task required to complete the response to an event. Also called a primitive process. • The lowest level of detail depicted in a process model.
When to Draw Process Models • Strategic systems planning • Enterprise process models illustrate important business functions. • Business process redesign • “As is” process models facilitate critical analysis. • “To be” process models facilitate improvement. • Systems analysis (primary focus of this course) • Model existing system including its limitations • Model target system’s logical requirements • Model candidate technical solutions • Model the target technical solution
Modern Structured Analysis(More Commonly Practiced) • Draw context diagram to establish initial project scope. • Draw functional decomposition diagram to partition the system into subsystems. • Create event-response or use-case list for the system to define events for which the system must have a response. • Draw an event diagram (or event handler) for each event. • Merge event diagrams into a system diagram (or, for larger systems, subsystem diagrams). • Draw detailed, primitive diagrams for the more complex event handlers. • Document data flows and processes in data dictionary.
Functional Decomposition Diagram • Break system into sub-components to reveal more detail. • Every process to be factored should be factored into at least two child processes. • Larger systems might be factored into subsystems and functions.
Events and Use Cases • External events are initiated by external agents. They result in an input transaction or data flow. • Temporal events are triggered on the basis of time, or something that merely happens. They are indicated by a control flow. • State events trigger processes based on a system’s change from one state or condition to another. They are indicated by a control flow. • Use case – an analysis tool for finding and identifying business events and responses. • Actor – anything that interacts with a system.
Balancing Balancing - a concept that requires that data flow diagrams at different levels of detail reflect consistency and completeness • Quality assurance technique • Requires that if you explode a process to another DFD to reveal more detail, you must include the same data flows and data stores
Process Logic • Data Flow Diagrams good for identifying and describing processes • Not good at showing logic inside processes • Need to specify detailed instructions for elementary processes • How to do it? • Flowcharts & Pseudocode - most end users do not understand them • Natural English - imprecise and subject to interpretation
Problems with Natural English • Many do not write well and do not question writing abilities. • Many too educated to communicate with general audience • Some write everything like it was a program. • Can allow computing jargon, acronyms to dominate language. • Statements frequently have excessive or confusing scope. • Overuse compound sentences. • Too many words have multiple definitions. • Too many statements use imprecise adjectives. • Conditional instructions can be imprecise. • Compound conditions tend to show up in natural English. Source: Adapted from Matthies, Leslie, The New Playscript Procedure, (Stamford, CT: Office Publications, Inc. 1977)
Structured English Structured English – a language syntax for specifying the logic of a process. • Based on the relative strengths of structured programming and natural English.
Structured English Restrictions on Process Logic • Only strong, imperative verbs may be used. • Only names that have been defined in project dictionary may be used. • Formulas should be stated clearly using appropriate mathematical notations. • Undefined adjectives and adverbs are not permitted. • Blocking and indentation are used to set off the beginning and ending of constructs. • User readability should always take priority.
Policies and Decision Tables Policy – a set of rules that govern show a process is to be completed. Decision table – a tabular form of presentation that specifies a set of conditions and their corresponding actions. • As required to implement a policy.