Download
1 / 35
370 likes | 508 Views
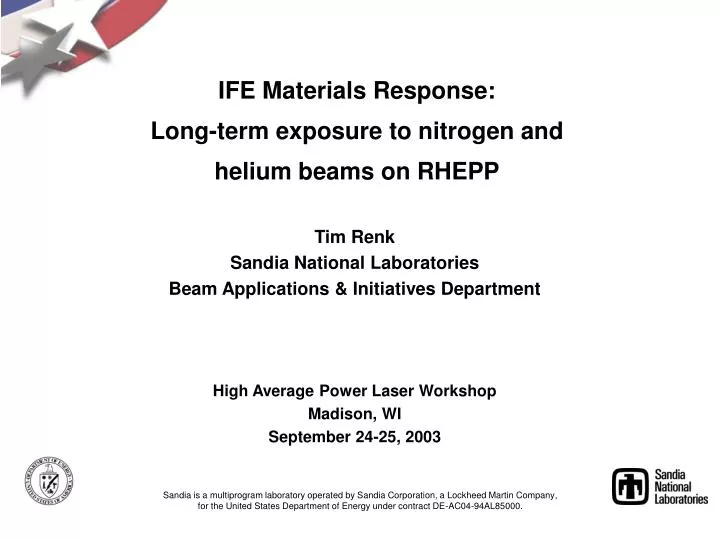
IFE Materials Response: Long-term exposure to nitrogen and helium beams on RHEPP. Tim Renk Sandia National Laboratories Beam Applications & Initiatives Department High Average Power Laser Workshop Madison, WI September 24-25, 2003.

E N D
IFE Materials Response:Long-term exposure to nitrogen andhelium beams on RHEPP Tim Renk Sandia National Laboratories Beam Applications & Initiatives Department High Average Power Laser Workshop Madison, WI September 24-25, 2003 Sandia is a multiprogram laboratory operated by Sandia Corporation, a Lockheed Martin Company,for the United States Department of Energy under contract DE-AC04-94AL85000.
Roughening threshold for 600C W predicted ~ 1.25 J/cm2; Looks like W/25Re has similar roughening, Mo worse • Smoothed W and Mo samples, provided by Lance Snead, were exposed to 250 MAP N pulses from ~ 1.5 to 6.1 J/cm2 • Sample temperature held to 580 < T < 600C - above brittle-ductile transition temp for both Mo and W • Roughening threshold for pure W appears to be ~ 1.25 J/cm2 , same as previously measured at RT by reflectometer. Similar scaling with fluence for W25Re • Mo exposed at 1.5 - 2.5 J/ cm2 roughens worse than heated W • Both W and Mo appear to roughen below melt Melting fluence: Mo: 2.2 J/ cm2 W: 2.5 J/ cm2 Pulsed Power Sciences, Sandia National Laboratories TJR 4/08/2003
Roughening threshold for 600C W predicted ~ 1.25 J/cm2; Looks like W/25Re has similar roughening, Mo worse • Smoothed W and Mo samples, provided by Lance Snead, were exposed to 250 MAP N pulses from ~ 1.5 to 6.1 J/cm2 • Sample temperature held to 580 < T < 600C - above brittle-ductile transition temp for both Mo and W • Roughening threshold for pure W appears to be ~ 1.25 J/cm2 , same as previously measured at RT by reflectometer. Similar scaling with fluence for W25Re • Mo exposed at 1.5 - 2.5 J/ cm2 roughens worse than heated W • Both W and Mo appear to roughen below melt Melting fluence: Mo: 2.2 J/ cm2 W: 2.5 J/ cm2 Pulsed Power Sciences, Sandia National Laboratories TJR 4/08/2003
Executive Summary • Materials response to pulsed ion exposure is affected greatly by grain structure. Roughening appears species-dependent for same dose, - He ions roughen worse than N. • Roughening: is worst for PowderMet W, heated or not. Response varies significantly amongst metals tested, - Cu roughens hardly at all, for example. Roughening evolves over hundreds of pulses, and appears open-ended. • Deep-lying cracking evident with W, W25Re, and Re. Depths are in the tens to hundreds of microns, and appear consistent with fatigue/stress cracking. Too deep for DekTak/WYCO to see. • CFC Graphite (222-FMI) suffers material loss over 1000 pulses at the 1.6 J/cm2 level, well below predicted ablation threshold. • Foams seem to suffer material loss over 800 pulses, but hard to tell exactly. • C-C-W Velvet (Knowles) subjected to 200 pulses up to 7 J/cm2, survives amazingly well. • Copper contamination an issue, but does not change major conclusions Pulsed Power Sciences, Sandia National Laboratories TJR 9/20/2003
Extended shot series taken since June 2003 • 450x Helium Series: W, Mo Powder Met W CVD W SingXtal, all 600C W25Re, Re • 1000x Nitrogen KS Series: W, Mo Powder Met 600C W25Re, Re CFC, Foams Ti-2, Al1100, Cu • 600x Nitrogen series: W, Mo Powder Met 600 C CFC, Foams higher fluence Pulsed Power Sciences, Sandia National Laboratories TJR 9/15/2003
Nitrogen injection into MAP produces 3-component beam of mostly N++, N+ • Beam predominantly N++ and N+ after small proton pulse at front • Peak voltage = 850 kV Peak current density (total) ~145 A/cm2 • Total fluence = 7.9 J/cm2 - will ablate almost all materials • Total pulse width ~ 200 ns • Ion range (TRIM): • N+ 0.9 µm, N++ 1.2 µm • Oxygen, Neon beams similar Shot 31661 Pulsed Power Sciences, Sandia National Laboratories TJR 6/6/2003
He beam (HE+1) pulsewidthis longer than N or C beam • He current lags voltage, leading to debunching • Current pulse width at 63 cm is almost 0.5 µsec long • Beam here was intentionally attentuated • He range in W (TRIM) ~ 0.9 µm • Range similar to N beam because singly charged Pulsed Power Sciences, Sandia National Laboratories TJR 7/26/03
Surface morphology changes on SS samples depend upon treatment ion(s) Map P 25x Map N 25x Map Ar 25x Modeling (Fe): Max Temp: 1658K No melting Modeling (Fe): Max Temp: 2593K Melt depth: 0.7 µm Modeling (Fe): Max Temp: 2072K Melt Depth: 0.45 µm • SS303 exposed to 25 shots each Map P, Map N, Map Ar @ 2 J/cm2 • ‘Finer’ surface features with N, Ar • Periodicity ~ 50 µm for N, Ar surface, ~ 70 µm for proton-treated surface Pulsed Power Sciences, Sandia National Laboratories TJR 8/25/2003
RHEPP-1 on Ti Alloy with 160-pulses O beam: Materials response governed at grain level ~6.0 J/cm2 Ra ~ 0.6 µm Ablation: >3000 Å/pulse Melt depth: > 4 µm ~2.0 J/cm2 Ra ~ 0.15 µm Ablation: Minimal Melt depth: 1.5 µm ~2.3 J/cm2 Ra ~ 0.25 µm Ablation: ~25 Å/pulse Melt depth: 1.75 µm ~2.7 J/cm2 Ra ~ 1 µm Ablation: ~300 Å/pulse Melt depth: ~2.25 µm ~4.0 J/cm2 Ra ~ 2 µm Ablation: ~2000 Å/pulse Melt depth: 3.25 µm • 600-800 kV, up to 200 A/cm2 (center-peaked) • Cratering, roughening worst at intermediate dose 5X microscope images Grains ~ 1 - 3 mm Pulsed Power Sciences, Sandia National Laboratories TJR 7/26/03
1000 shot KS Series: Test heated W, Mo at low level, Materials Tests of W25Re, Re, Cu, Ti-2, Al1100, Foams, CFC • Photo shows plate with heated W, Mo on right. Goal: melting temp (max 2.5 J/cm2) • Other (unheated) samples arrayed on left. CFC and Foams at 1.6 J/ cm2, rest up to 4 J/ cm2 • Samples shot 200X, Ra measured by 1-D Dektak, then reloaded for another 200X (not Foams and CFC) • SEMS, WYCO 2-D profilometry after 1000X (800X for foams and Cu) • W/Mo + Foams and CFC exposed at higher dose on next 600 shot series • Foams: W, Re, Nb, Mo Pulsed Power Sciences, Sandia National Laboratories TJR 9/15/2003
Tungsten roughening (Room Temperature): Detailed History of Reflectometer measurements • Polished W exposed to N beam: 0.6 <dose< 1.25 J/cm2 (53 shots) • Reflectometer photodiode signal (red) plotted as function of shot number (26081 - 26127) • Initial exposure at 1 J/cm2 or less: photodiode remains above 20 mV • Note progressive signal decrease after shot 26,112. Fluence is ~ 1.25 J/cm2 Pulsed Power Sciences, Sandia National Laboratories TJR 8/8/03
400 shot Map N shots on Tungsten (Room Temperature): Roughening only above threshold • Polished W exposed to 400 shots N beam: 1.0 < fluence < 3.7 J/cm2 • Room Temp (RT) exposure • Roughening occurs above 1.25 J/cm2, consistent with single-shot reflectometer roughening threshold • Powder Met Mo (one point at 2.5 J/cm2 ): roughness stays near unexposed value • Above threshold, roughening is a severe function of fluence. Maximum Ra exceeds 22 µm, with P-V height above 70 µm Pulsed Power Sciences, Sandia National Laboratories TJR 8/8/03
He Beam exposure, 450 shots; Powder Met W has worst roughening, even when heated • Smoothed PowderMetW, CVDW, and single XtalW, provided by Lance Snead, were exposed to 450 MAP He pulses ~ 1.0 to 1.3 J/cm2. Heated to 600C, heated 3X including heater failure • W/25Re and Re samples also treated, from 1.3 to 2.5 J/cm2. Samples at RT • PwderMetW Roughening is significantly worse than CVD or Single Crystal W. Latter are similar to powderMet W/25Re and Re. None are roughening appreciably compared to untreated. • Surface morphology for SingXtal and CVD W different from PowderMetW. Melting fluence: W/25Re: 2.7 J/ cm2 W: 2.3 J/ cm2 with 600C heating Pulsed Power Sciences, Sandia National Laboratories TJR 7/28/03
He Beam treatment 450 shots: 600C W roughens w/o melt worse than W/Re with melt Single Xtal W (Snead) Fluence: 1 - 1.3 J/ cm2 Max Temp (Code): 1900K Ra: 0.5 - 0.6 µm W/25Re Fluence: up to 4 J/ cm2 Ra : < 0.2 µm (Circles are melted Cu) Powder Met W Same fluence Ra : 2 - 3 µm These surfaces did not melt This surface melted Pulsed Power Sciences, Sandia National Laboratories TJR 7/26/2003
Evolution of Ra Roughness for W: PowderMet, CVD, SingXtal - He and N beams, up to 1000 shots • Polished W samples exposed to 450 shots He, and 600/1000 shots N beam: 1.25 (He) < fluence < 2.5-4.5 J/cm2 (N) • All samples exposed at 550-600C • PowderMet W roughens much worse than CVD or SingXtal (one data pt) • Roughening with shot number up to 600-100 shots for PowderMet. Slope for 4.5 J/ cm2 twice that of 2.5 J/cm2 • Roughening with He beam at 1.25 J/cm2 comparable to N at 2.5 J/cm2 • Peak-Valley plot almost identical with Ra plot, except max = 80 µm Pulsed Power Sciences, Sandia National Laboratories TJR 9/18/2003
Evolution of Ra, Peak-Valley Roughness at 2.5 J/cm2: WPowderMet is worst, then Al1100, Mo and Ti-2 Pulsed Power Sciences, Sandia National Laboratories TJR 9/18/2003
Evolution of Ra Roughness at 4.0 J/cm2: WPowderMet, then everything else. Cu does NOT roughen • 4 J/cm2 is near or above ablation level for most metals shown • Polished W and Mo are heated to 550 - 600C • W roughens beyond 10 µm Ra at 400-600 shots (only 600 taken) • W25Re, Re reach 2 µm Ra at 1000 shots, but Cu remains below 1 µm • Ti-2 (not shown) roughens steadily to 1000 shots • W Peak-Valley exceeds 70 µm at 600 shots Pulsed Power Sciences, Sandia National Laboratories TJR 9/18/2003
W (Powder Met) roughening: Ra as function of Number of Nitrogen pulses @ 4.0 J/cm2 I-D 8 mm Profilometer Scans, 450x He (Left) and Nitrogen (Right) (He) (None) (N 200X) (He) (None) (N 400X) (He) (None) (N 600X) Ra ~ 1-3 µm P-V ~ 10-30 µm Ra ~ 1-3 µm P-V ~ 5-15 µm Ra ~ 4-9 µm P-V ~ 20-35 µm Ra ~ 7-10 µm P-V ~ 50-70 µm Pulsed Power Sciences, Sandia National Laboratories TJR 09/08/2003
W (Powder Met) roughening: SEM images as function of shot number: 60 to 1000X (N 60X @ 6 J/cm2) (N 250X @ 2.5 J/cm2) He 450X @ 1-1.3 J/cm2) (N 600X @ 4.0 J/cm2) (N 1000X @ 2.5 J/cm2) Pulsed Power Sciences, Sandia National Laboratories TJR 9/21/2003
SEM images of different metals @ 500X Mag: 450XHe to 1000X N (W25Re 450X He @ 2.5 J/cm2) (W CVD 450X He @ 1-1.3 J/cm2) Ti-2 1000X @ 2.6 J/cm2) (Cu 1000X @ 2.6 J/cm2) (Re 1000X @ 2.6 J/cm2) Pulsed Power Sciences, Sandia National Laboratories TJR 9/21/2003
SEM images of Ti-2 and Re: Lateral scale length with fluence increase (Ti-2 @ 1.6 J/cm2) Ti-2 @ 4.0 J/cm2) (Ti-2 @ ~ 1.0 J/cm2) Ti-2 @ 2.6 J/cm2) Length scale decreases for Ti-2, increases for Re (Re 1000X @ 4.0 J/cm2) (Re 1000X @ 2.6 J/cm2) Pulsed Power Sciences, Sandia National Laboratories TJR 9/21/2003
(Upper) SEM : Al1100, 1000x Map N @ 500X Mag Lower: Cu 1000x Map N @ 2.5 J/cm2 Al1100 1000xN @ 0.85 J/cm2 Al1100 1000xN @ 1.6 J/cm2 Al1100 1000xN @ 2.5 J/cm2 (Re 1000X @ 2.6 J/cm2) Pulsed Power Sciences, Sandia National Laboratories TJR 9/21/2003 (Cu 1000X @ 2.6 J/cm2)
FMI-222 CFC SEM images as function of fluence: W and Mo W Untreated W Treated at 1.6 J/cm2 600X W Treated at 3.0 J/cm2 600X Mo Untreated Mo Treated at 1.6 J/cm2 600X Mo Treated at 3.0 J/cm2 600X Pulsed Power Sciences, Sandia National Laboratories TJR 9/20/2003
FMI-222 CFC SEM images as function of fluence: Re and Nb Re Untreated Re Treated at 1.6 J/cm2 600X W Treated at 3.0 J/cm2 600X Nb Untreated Nb Treated at 1.6 J/cm2 600X Nb Treated at 3.0 J/cm2 600X Pulsed Power Sciences, Sandia National Laboratories TJR 9/20/2003
Response of graphite to mixed H - C beam qualitatively confirms BUCKY predictions • Mechanically polished pyrolitic graphite (PG), Poco, and 4D carbon composite weave exposed to 75 pulses/225 pulses of 70% C /30% H beam at doses of 1.9 to 5 J/cm2 • PG ablation threshold ~ 4 J/cm2 • Poco ablation threshold ~ 3 J/cm2 • Above threshold, rapid increase in ablated material per pulse with dose. Data scatter reflects uncertainty in dose • Composite matrix ablates more than PG/Poco, fibers comparable (sample rough) Pulsed Power Sciences, Sandia National Laboratories TJR 11/29/2002
FMI-222 unheated CFC exposed to MAP N for 1000X at 1.6 J/cm2: Significant erosion of matrix 0 - 60 µm - 120 µm Treated at 1.6 J/cm2 Untreated Pulsed Power Sciences, Sandia National Laboratories TJR 9/20/2003
FMI-222 Fiber ends appear ablation-resistant; Matrix loss ~ 0.3 µm/pulse at 4.0 J/cm2: Treated at 1.6 J/cm2 1000X Treated at 2.6 J/cm2 600X Treated at 4.0 J/cm2 600X 0 0 0 - 100 µm - 100 µm - 100 µm 0 Pulsed Power Sciences, Sandia National Laboratories TJR 9/20/2003
FMI-222 CFC SEM images as function of fluence Treated at 1.6 J/cm2 1000X 120MAG Treated at 2.6 J/cm2 600X 120MAG Treated at 4.0 J/cm2 600X 120MAG Untreated fiber end Fiber end 4.0 J/cm2 600X Matrix 4.0 J/cm2 600X Bottom images all 500MAG Pulsed Power Sciences, Sandia National Laboratories TJR 9/24/2003
Observe Tips eroded, but still coated? No peeling of W film; substrate clean Surfaces roughened Top Middle Bottom CCV/W at High Exposure
CCV/W can be fabricated with controlled packing density, fiber orientation, W film coating suitable for RHEPP exposure Low fluence response shows damage to coating W films peel off fibers, accumulate at base High fluence response shows much less damage No apparent damage to substrate – velvet protects substrate from RHEPP exposure No W debris accumulating at substrate Fiber shafts are slightly roughened (<1 mm) Fiber tips show some erosion High fluence heating appears to join W to C Velvet Conclusions
Summary • Tungsten: surface roughening excessive (PowderMet), with fatigue cracking below surface maybe even worse. Mitigating: CVD/SingXtal, alloying with Re, heating. Cracking looks like enough to compromise performance as armor coating. • Roughening occurs over hundreds of shots. Topology may stabilize for W by 1000 shots, looks to increase for other metals beyond this. • Below the roughening threshold (1.25 J/cm2), W may be topologically stable with shot number. • If there is a material loss threshold for CFC Graphite (222-FMI), it is below the 1.6 J/cm2 level. • Performance of foams needs further study. • Most promising performers? C-C-W Velvet, Cu Pulsed Power Sciences, Sandia National Laboratories TJR 9/20/2003