Download
1 / 10
100 likes | 233 Views
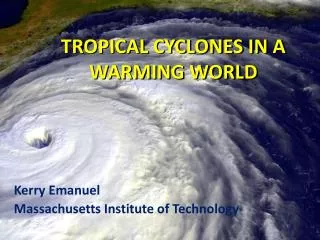
A Study of Visual Communication: Cyclones, Cones and Confusion. Gina Eosco AMS Policy Program University of Oklahoma. Study Goals. Original Goal: What is wrong with the cone of uncertainty?

E N D
A Study of Visual Communication: Cyclones, Cones and Confusion Gina Eosco AMS Policy Program University of Oklahoma
Study Goals Original Goal: What is wrong with the cone of uncertainty? Current Goal: Phase 1 of answering, how does scientific intent translate through a graphic to evoke public understanding of science and risk assessment 2 Forecasters Public 1 Slide Title • Level 1 • Level 2 Evacuate? Stay home? It won’t hit me.
Message Objectives • Scientific Uncertainty • “Bottom line the answer to your question is whether we’ll be able to give the public an idea of the uncertainty to provide the real detailed information, well how to use it to decision makers at the local and state level to help them with their tough calls.” • Risk (Impacts) • “If you were close enough to that track … then know you should expect damage within 50 miles of landfall.” • Confidence (certainty) • “It [the cone] represents where we expect the center of circulation to be, within the next so many days, and we have timelines on there every 12 hours. It represents the certainty of where we expect the center of circulation to be, only the circulation, not the impacts.”
Behavioral Objectives • Beginning of Hurricane Season…………… Prepare now! • Formation……………………………………………. Keep Listening • 5-day Cone………………………………………….. Prepare for a possible hurricane • ………………………………….. ….. Start listening to your emergency managers (EMs)/local decision makers • 3-day Cone………………………………………….. Begin to Implement Hurricane plan/Listen to EMs • Hurricane/Tropical Storm Watch……….. Listen to EMs/Implement Your Plan! • Hurricane/Tropical Storm Warning…….. Implement Your Plan!!
What does all of this mean? • Visuals may have a complex relationship between its design and its verbal/written objectives. • How do these variables interact? And with what effect? • Visual framing may help scientists create visuals that achieve high visual validity, that is, the public may take away the intended message. • Can we create guidelines for visual framing? • What other factors play into achieving visual validity?
Discussion questions • What are the opportunities to extend the collaborations across sectors & across disciplines to improve forecast effectiveness & broader understanding of weather and climate science? • What innovative strategies can we recommend for increasing beneficial communication, collaborations, & coordination within all aspects of the enterprise, & among all sectors of the weather and climate community?
Questions relevant to the Enterprise How do people use forecast and warning information to make decisions? What weather forecast and warning information do people want? How can we better understand varying levels of impacts caused by weather events? How are people affected differently by the same weather events due to their varying vulnerabilities and abilities to take action? How can we more effectively communicate weather forecast uncertainty information? How do we provide good weather forecast and warning information given the proliferation of information (sources, media, modes)?