1 / 3

図1 精度と妥当性

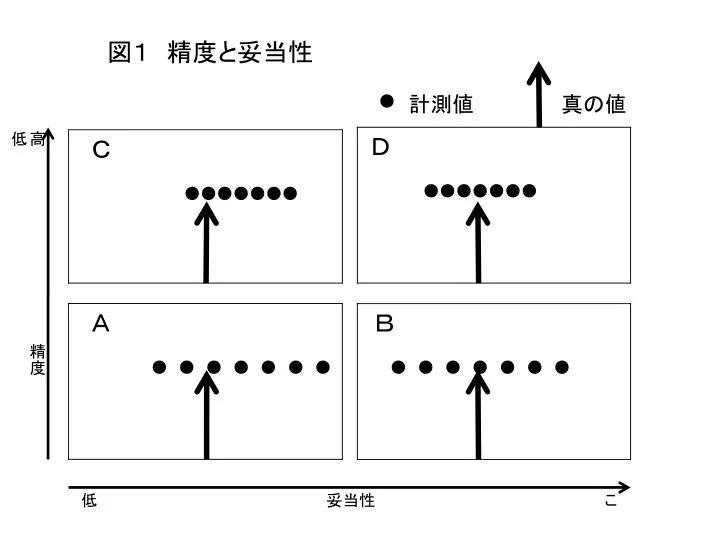
図1 精度と妥当性. 計測値      真の値. ●. 高            精度            低 . 低                     妥当性                     こ                    . 表1 年齢調整死亡率の計算. 直接法. 間接法. ( ) 内の % は全人口に対する各年齢群の割合. 粗死亡率 =1570/300=5.2 (人口千対) 調整死亡率 =[(65/100)x750+(275/100)x550+(1230/90)x200]/1500

Download Presentation

図1 精度と妥当性

An Image/Link below is provided (as is) to download presentation Download Policy: Content on the Website is provided to you AS IS for your information and personal use and may not be sold / licensed / shared on other websites without getting consent from its author. Content is provided to you AS IS for your information and personal use only. Download presentation by click this link. While downloading, if for some reason you are not able to download a presentation, the publisher may have deleted the file from their server. During download, if you can't get a presentation, the file might be deleted by the publisher.

E N D

Presentation Transcript


  1. 図1 精度と妥当性 計測値      真の値 ● 高            精度            低  低                     妥当性                     こ                    

  2. 表1 年齢調整死亡率の計算 直接法 間接法 ( )内の%は全人口に対する各年齢群の割合 粗死亡率=1570/300=5.2(人口千対) 調整死亡率=[(65/100)x750+(275/100)x550+(1230/90)x200]/1500 =[488+1513+2733]/1500 =3.2 (人口千対) ・ 直接法による年齢調整死亡率を計算するには、対象集団の年齢別死亡数、年齢別人口、基準集団の年齢別人口が必要 ・ 対象集団の年齢別死亡率を基準集団の人口構成に当てはめて計算する(対象集団の人口構成が基準集団と同じであったらどうなるか) 粗死亡率=1570/300=5.2(人口千対) 標準化死亡比=1570/[100x0.5+110x2.5+90x20.5]=1570/2170=0.72 年齢調整死亡率=3.9x0.72=2.8 (人口千対) ・ 間接法による年齢調整死亡率を計算するには、対象集団の総死亡数、年齢別人口、基準集団の年齢別死亡率、総死亡率が必要 ・ 基準集団の年齢別死亡率を対象集団の人口構成に当てはめて計算する(対象集団の各年齢群が基準集団の死亡率であったらどうなるか)

  3. 図2 肥満及び運動能力区分別死亡率 腹囲高値: 男102cm以上,女88cm以上 体脂肪割合高値: 男25%以上,女30%以上 (資料:Sui X ほか. JAMA 2007;298:2507-16)

More Related