Download
1 / 19
300 likes | 348 Views
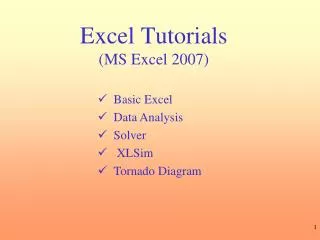
Intro to MS Excel. This is only an introduction!!. In CAMS101/CCDI111, we will use Excel to:. Store and organize data, Analyze data, and Represent data graphically (e.g., in bar graphs, histograms, and scatterplots ) All with a financial slant !!. Excel Basics.

E N D
Intro to MS Excel This is only an introduction!!
In CAMS101/CCDI111, we will use Excel to: • Store and organize data, • Analyze data, and • Represent data graphically (e.g., in bar graphs, histograms, and scatterplots) • All with a financial slant!!
Excel Basics Excel spreadsheets organize information (text and numbers) by rows and columns: This is a row. Rows are represented by numbers along the side of the sheet. This is a column. Columns are represented by letters across the top of the sheet.
Excel Basics A cell is the intersection between a column and a row. Each cell is named for the column letter and row number that intersect to make it.
Data Entry 1. Type directly into the cell. Click on a cell, and type in the data (numbers or text) and press Enter. 2. Type into the formula bar. Click on a cell, and then click in the formula bar (the space next to the ). Now type the data into the bar and press Enter. There are two ways to enter information into a cell:
Let’s START? • Open Excel (Start All Programs MS Office Excel). • Do the following: • Highlight Cell A1; B7 • Highlight the Range: B2:B9; C3:G9; • “ “ :B3:B9 AND F5:F10 • Formulae: • Calculate 8*3; 21 – 55; 7-2*3 IN cell C5
Formulas and Functions • Formulas are equations that perform calculations in your spreadsheet. Formulas always begin with an equals sign (=). When you enter an equals sign into a cell, you are basically telling Excel to “calculate this.” • Functions are Excel-defined formulas. They take data you select and enter, perform calculations on them, and return value(s).
More on Functions • All functions have a common format – the equals sign followed by the function name followed by the input in parentheses. • The input for a function can be either: • A set of numbers (e.g., “=AVERAGE(2, 3, 4, 5)”) • This tells Excel to calculate the average of these numbers. • A reference to cell(s) (e.g., “=AVERAGE(B1:B18) or “=AVERAGE (B1, B2, B3, B4, B5, B6, B7, B8)” • This tells Excel to calculate the average of the data that appear in all the cells from B1 to B8. • You can either type these cell references in by hand or by clicking and dragging with your mouse to select the cells.
Functions for Descriptive Statistics Below are several functions you will need to learn for this class. Try them out with the practice data set. =AVERAGE(first cell:last cell): calculates the mean =MEDIAN(first cell:last cell): calculates the median =MODE(first cell:last cell): calculates the mode =VARP(first cell:last cell): calculates the variance =STDEVP(first cell:last cell): calculates the standard deviation • You may directly write the functions for these statistics into cells or the formula bar, OR • You may use the function wizard ( in the toolbar)
More on Functions: • Your Excel spreadsheet should now look like this:
Revision: Formulas • A formula is a sequence of values, cell references and operators that produce a new value. = E8 + 3*(E10 - E11) • Formulas always start with an equal sign = • In addition a formula can also contain built-in functions like SUM, AVERAGE, IF, COUNTIF, etc. =Sum(A2:A8)*2
Let’s look forward: • MS Excel: • EX Chapter 01 • EX Chapter 02 • EX Chapter 03 • www.misuz.yolasite.com > practicals
Highlight your data, select a Chart type and Edit & its done!
Things you need to know when writing formulas in Excel • Data precision vs. cell display • Types of operators that can be used • Order of precedence of operators / ≤ − =B2+B3*B1/B8^2
In order to write Excel formulas we also need to use the correct Operator Symbols Formulas contain two types of components: • Operators: Operations to be performed Arithmetic operators: * / + - ^ Relational operators: >, <, <=, >=,< >,= • Operands: Values to be operated on Addition Operator = B2+5 Operands
Precedence of Operators • ( ) Parenthesis is a special operator that forces evaluation of the expression inside it first • Exponentiation (2^3 8) • Arithmetic operators: Multiplication & Division • Multiplication & Division have equal precedence and are evaluated from left to right • Arithmetic operators: Addition & Subtraction • Addition & Subtraction have equal precedence and are evaluated from left to right • Relational operators have a lower precedence than arithmetic operators
Walkthrough: Building a Simple Spreadsheet • Entering labels and values • Formatting cells • font, size, style, color, borders, alignment • Numeric Format, Currency, Decimal Places • text wrap, center titles • Column widths, row height • Inserting/Deleting rows and columns and sheets • Writing a simple formula & modify decimal display • Create a simple chart • Sheet tabs • Creating a new worksheets in a workbook (“new sections in a document”, Naming Sheets