Download
1 / 1
10 likes | 157 Views
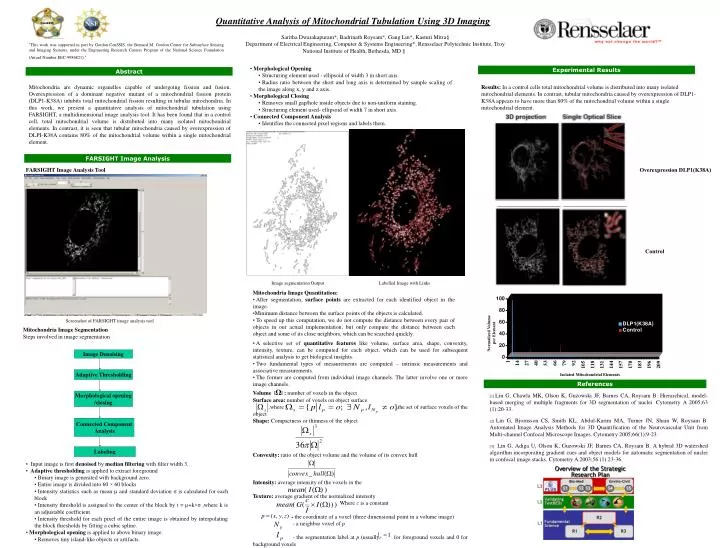
Quantitative Analysis of Mitochondrial Tubulation Using 3D Imaging. Saritha Dwarakapuram*, Badrinath Roysam*, Gang Lin*, Kasturi Mitra§ Department of Electrical Engineering, Computer & Systems Engineering*, Rensselaer Polytechnic Institute, Troy

E N D
Quantitative Analysis of Mitochondrial Tubulation Using 3D Imaging Saritha Dwarakapuram*, Badrinath Roysam*, Gang Lin*, Kasturi Mitra§ Department of Electrical Engineering, Computer & Systems Engineering*, Rensselaer Polytechnic Institute, Troy National Institute of Health, Bethesda, MD § "This work was supported in part by Gordon-CenSSIS, the Bernard M. Gordon Center for Subsurface Sensing and Imaging Systems, under the Engineering Research Centers Program of the National Science Foundation (Award Number EEC-9986821)." • Morphological Opening • Structuring element used - ellipsoid of width 3 in short axis. • Radius ratio between the short and long axis is determined by sample scaling of the image along x, y and z axis. • Morphological Closing • Removes small gap/hole inside objects due to non-uniform staining. • Structuring element used- ellipsoid of width 7 in short axis. • Connected Component Analysis • Identifies the connected pixel regions and labels them. Experimental Results Abstract Mitochondria are dynamic organelles capable of undergoing fission and fusion. Overexpression of a dominant negative mutant of a mitochondrial fission protein (DLP1-K38A) inhibits total mitochondrial fission resulting in tubular mitochondria. In this work, we present a quantitative analysis of mitochondrial tubulation using FARSIGHT, a multidimensional image analysis tool. It has been found that in a control cell, total mitochondrial volume is distributed into many isolated mitochondrial elements. In contrast, it is seen that tubular mitochondria caused by overexpression of DLPI-K38A contains 80% of the mitochondrial volume within a single mitochondrial element. Results: In a control cells total mitochondrial volume is distributed into many isolated mitochondrial elements. In contrast, tubular mitochondria caused by overexpression of DLP1-K38A appears to have more than 80% of the mitochondrial volume within a single mitochondrial element. FARSIGHT Image Analysis FARSIGHT Image Analysis Tool Overexpression DLP1(K38A) Control Image segmentation Output Labelled Image with Links • Mitochondria Image Quantitation: • After segmentation, surface points are extracted for each identified object in the image. • Minimum distance between the surface points of the objects is calculated. • To speed up this computation, we do not compute the distance between every pair of objects in our actual implementation, but only compute the distance between each object and some of its close neighbors, which can be searched quickly. Screenshot of FARSIGHT image analysis tool Mitochondria Image Segmentation Steps involved in image segmentation Normalized Volume per Element • A selective set of quantitative features like volume, surface area, shape, convexity, intensity, texture, can be computed for each object, which can be used for subsequent statistical analysis to get biological insights. • Two fundamental types of measurements are computed – intrinsic measurements and associative measurements. • The former are computed from individual image channels. The latter involve one or more image channels. • Volume |Ω| : number of voxels in the object • Surface area: number of voxels on object surface • ,where ,the set of surface voxels of the object • Shape: Compactness or thinness of the object • Convexity: ratio of the object volume and the volume of its convex hull • Intensity: average intensity of the voxels in the • Texture: average gradient of the normalized intensity • Where C is a constant • - the coordinate of a voxel (three dimensional point in a volume image) • - a neighbor voxel of p • - the segmentation label at p (usuallyfor foreground voxels and 0 for background voxels Image Denoising Adaptive Thresholding Isolated Mitochondrial Elements References Morphological opening /closing [1] Lin G, Chawla MK, Olson K, Guzowski JF, Barnes CA, Roysam B. Hierarchical, model-based merging of multiple fragments for 3D segmentation of nuclei. Cytometry A 2005;63 (1):20-33. [2] Lin G, Bjornsson CS, Smith KL, Abdul-Karim MA, Turner JN, Shain W, Roysam B. Automated Image Analysis Methods for 3D Quantification of the Neurovascular Unit from Multi-channel Confocal Microscope Images. Cytometry 2005;66(1):9-23. [3] Lin G, Adiga U, Olson K, Guzowski JF, Barnes CA, Roysam B. A hybrid 3D watershed algorithm incorporating gradient cues and object models for automatic segmentation of nuclei in confocal image stacks. Cytometry A 2003;56 (1):23-36. Connected Component Analysis Labeling • Input image is first denoised by median filtering with filter width 3. • Adaptive thresholding is applied to extract foreground • Binary image is generated with background zero. • Entire image is divided into 60 × 60 blocks • Intensity statistics such as mean µ and standard deviation σ is calculated for each block • Intensity threshold is assigned to the center of the block by t = µ+k×σ ,where k is an adjustable coefficient. • Intensity threshold for each pixel of the entire image is obtained by interpolating the block thresholds by fitting a cubic spline. • Morphological opening is applied to above binary image. • Removes tiny island-like objects or artifacts.