Download
1 / 22
350 likes | 983 Views
TECHNICAL ANALYSIS AND THE RANDOM-WALK THEORY. MUSTAFA ERGAZİLİ 108592 YUSUF ERTÜRK 070794. Topics Covered ;. Introduction Technical Analysis vs Fundamental Analysis What is the "random walk theory" and what does it mean for investors ? Detailed C harting T echniques Conclusion.

E N D
TECHNICAL ANALYSIS AND THE RANDOM-WALK THEORY MUSTAFA ERGAZİLİ 108592 YUSUF ERTÜRK 070794
Topics Covered ; Introduction Technical Analysis vs Fundamental Analysis What is the "random walk theory" and what does it mean for investors? Detailed ChartingTechniques Conclusion
Introduction In this chapter, Malkiel discusses whether or not technical analysisactually works. We will answer this, at the end of our presentation.
Technical Analysis ? Technical Analysis : A method of evaluating securities by analyzing statistics generated by market activity, such as past prices and volume. Technical analysts do not attempt to measure a security's realvalue, but instead use charts and other tools to identify patterns that can suggest future activity. Technical analysts believe that the historical performance of stocks and markets are indications of future performance. For example,in a shopping centre a technical analyst would sit on a bench in the mall and watch people go into the stores. Disregarding the real value of the products in the store, the technical analyst's decision would be based on the patterns or activity of people going into each store.
Fundamental Analysis Fundamental Analysis: A method of evaluating a security that causes attempting to measure its intrinsic value by examining related economic, financial and other qualitative and quantitative factors. Fundamental analysts attempt to study everything that can affect the security's value, including macroeconomic factors (like the overall economy and industry conditions) and company-specific factors (like financial condition and management).
Market Momentum Definition of 'Market Momentum' A measure of overall market sentiment, calculated as the change in the value of a market index multiplied by the aggregate trading volume occurring within the index components.
Is there Momentum in the stock market ? The technician believes that knowledge of a stock'spast behavior can help predict its probable future behavior. In otherwords, the sequence of price changes before any given day is important in predicting the price changefor that day. This might be called the wallpaper principle. The technical analyst tries to predict futurestock prices just as we might predict that the pattern of wallpaper behind the mirror is the same as thepattern above the mirror.
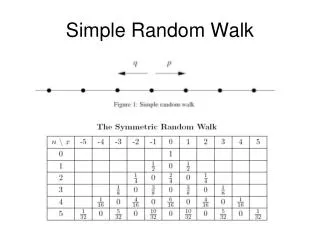
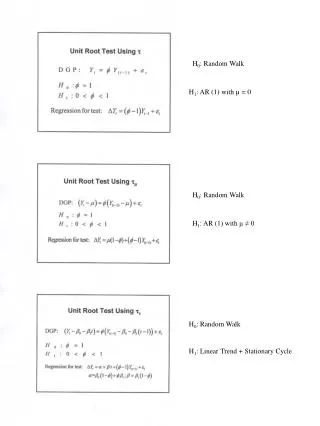
Random Walk Definition of 'Random Walk Theory' *The theory that stock price changes have the same distribution and are independent of each other, so the past movement or trend of a stock price or market cannot be used to predict its future movement. What does it mean for investors? *Investors should not believe to this theory, because it is impossible to predict the future stock prices or future movements.
Technical Systems 1-)The Filter System :Filtermethod is what lies behind the popular "stop-loss" order favored bybrokers, where the client is advised to sell his stock if it falls 5 percent below his purchase price to"limithis potential losses." The argument is that probablystock that falls by 5 percent will be goinginto a downtrend anyway.
Technical Systems(cont.) 2-)Dow Theory : The basic Dow principle implies a strategy of buying when the market goes higher than the last peakand selling when it sinks through the preceding valley. There are various wrinkles to the theory, such aspenetration of a double or triple top being especially bullish, but the basic idea is followed by manychartists and is part of the gospel of charting.
Technical Systems(cont.) 3-)The Relative-Strength System: system an investor buys and holds those stocks that are acting well, thatis,outperformingthe general market indices in therecent past. Conversely, the stocks that are acting poorly relative to the market should be avoided or, perhaps, even sold short.So it is a "buy high, sell higher" strategy that assumes a stock whose price has been rising will continue its upward trajectory.
Technical Systems(cont.) 4-) Price-Volume Systems: Price-volume systems suggest that when a stock (or the general market) rises on large or increasingvolume, there is an unsatisfied excess of buying interest and the stock can be expected to continue itsrise. Conversely, when a stock drops on large volume, selling pressure is indicated and a sell signal isgiven.
The Hemline Indicator A theory that stock prices move in the same direction as the hemlines of women's dresses. For example, short skirts (1920s and 1960s) are symbolic of bullish markets(prices expected to rise)and long skirts (1930s and 1940s) are symbolic of bearish markets(prices of securities are falling). That is, when women wear short skirts, there is or will be a bull market; when they wear long skirts, there is or will be a bear market.
The Super Bowl Indicator The Super Bowl indicator is a superstition,it forecasts how the stock market will perform based on which team wins the Super Bowl(NFL).
The Odd-Lot Theory Technical analysis theory based on the assumption that the small individual investor is always wrong. Therefore, if odd lot sales are up - that is small investors are selling stock - it is probably a good time to buy.
Conclusion In this chapter, Malkiel discusses whether or nottechnical analysis actually works. The answer is NO. Malkiel himself claims not to know a single chartist who has become rich because of his investing technique, but he knows many who have gone broke. On the other hand, he knows many who have done well, not because of their technique, but because they have managed to persuade others to spread their portfolios and therefore generate brokerage fees. The main problem facing investors is determining when to buy and when to sell a stock.