Download
1 / 35
350 likes | 460 Views
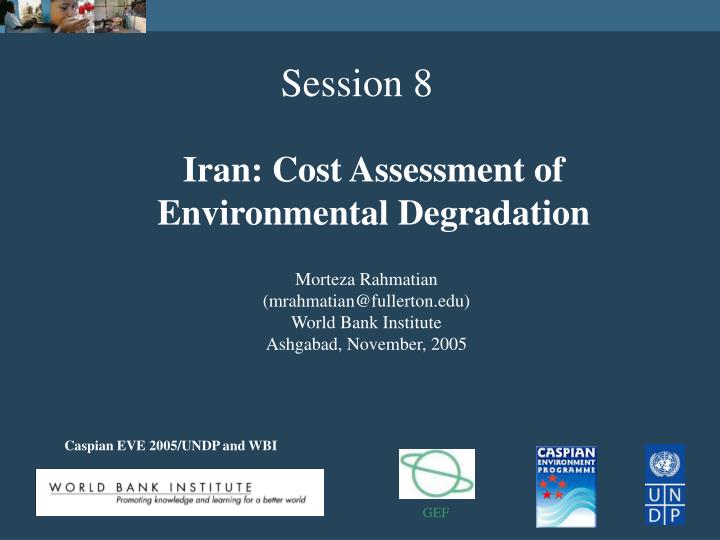
Session 8. Iran: Cost Assessment of Environmental Degradation. Morteza Rahmatian (mrahmatian@fullerton.edu) World Bank Institute Ashgabad, November, 2005. Caspian EVE 2005/UNDP and WBI. GEF. Cost of Environmental Degradation. From materials prepared by Maria Sarraf Marwan Owaygen.

E N D
Session 8 Iran: Cost Assessment of Environmental Degradation Morteza Rahmatian (mrahmatian@fullerton.edu) World Bank Institute Ashgabad, November, 2005 Caspian EVE 2005/UNDP and WBI GEF
Cost of Environmental Degradation From materials prepared by Maria Sarraf Marwan Owaygen Islamic Republic of Iran
Present the Main Findings of the Report • Water • Land • Air • Coastal • Waste • Forest Caspian EVE 2005/UNDP and WBI Morteza Rahmatian, Iran: Cost Assessment of Environmental Degradation
What’s the objective? • To assign amonetaryvalue (using latest environmental economics methodologies and data available) to damages resulting from environmental degradation in Iran in 2002 Caspian EVE 2005/UNDP and WBI Morteza Rahmatian, Iran: Cost Assessment of Environmental Degradation
What’s the point? • It allows comparison between various environmental categories (air, water, land, forest, waste etc.) • It enables comparison with other economic indicators • It enables comparison between the “benefits” and the “costs” of investing in natural resource management • It raises awareness about environmental degradation beyond the environment audience • It gives “environment ministers” a tool to discuss the importance of environmental protection using the samelanguageas ministers of finance. Caspian EVE 2005/UNDP and WBI Morteza Rahmatian, Iran: Cost Assessment of Environmental Degradation
Water–Impact on Health • Mortality: Based on Iranian health experts, diarrhea disease is responsible for about 12.5 % of children death. That means that about 8,600 children under 5 years old die every year. This is equivalent to 246,000 DALYs (1 death = 33 DALYs) • Morbidity: DHS survey in Iran showed that diarrhea prevalence in children in the last 10 days is 22 %, using an average duration of diarrhea of 4 days, an avoidance ratio of 85%, a severity weight of 0.11, and an age weight of 0.31 the estimated no. of DALY lost for children is 15,000. Using a same methodology DALY lost due to diarrhea diseases population above 5 years is 67,000. • Cost of illness: In addition to pain and suffering from illness (measured by DALY) one should also add the cost of treating diarrhea (medication, doctor’s visit) as well as the time spent by care givers to take care of sick children. • Estimated costs $2.5 billion or Rials 20,000 billion (2.2% GDP)
Water–Underground Water Depletion 1. Decrease in Water Table: Groundwater exploitation constitutes 54% of total water withdrawal. Before 1960 groundwater extraction was estimated at 20 BCM per year. In 2002 this number reached 73.8 BCM. This increase in mainly due to the drastic rise in the number of wells. Current abstraction from aquifers exceeds the safe yield by 3.2 BCM. Overexploitation of groundwater results in decrease in the water table, and in extreme cases in the penetration of salty waters into aquifers and destruction of soil quality.
Water–Underground Water Depletion 1. Decrease in Water Table: To assess damage costs, we looked at the additional pumping costs needed to extract water from a deeper water level. The main additional variable costs is fuel. The amount of diesel required to extract 1 m3 of water per meter depth is 0.004 liter. Given an average market price of diesel of 18 cents/liter. Total present value of damage costs is $200 million (0.17% GDP). 2. Well replacement costs: overexploitation of groundwater also results in the need to abandon wells and dig new ones. Total number of new wells 3,500 / yr (85% due to decline in water table). Cost of digging new well $43,000 and $53,000 Annual costs $332 million (0.3 % GDP) 3. Groundwater pollution: rapid survey undertaken during this study reveals that in 2002 out of 450 new wells (drinking water) every year about 60 were abandoned due to water pollution. Annual costs $3 million
Water–Dam Sedimentation • Iran has 151 dams in operation with a capacity of 25 BCM. • Water from storage and diversion dams irrigate 22 % of irrigated land • Deforestation, overgrazing, etc. resulted in soil erosion estimated at 30 tons/ha/year and sediment loads 10 tons/ha/year. Loss in reservoir storage capacity: 236 MCM (1 % of dam storage capacity) • Damage costs estimated in terms of potential loss in irrigated crops (approximated by potential loss in wheat (31% of irrigated land). • Estimated the productivity of “irrigated” water in terms of wheat production: $0.1/m3. (opportunity cost of water) • NPV $370 or Rials 3,000 billions (0.33% GDP)
LAND DEGRADATION WETLAND RANGELAND FLOODS & SOIL EROSION IRRIGATED AGRICULTURAL LAND SALINTY FOREST Caspian EVE 2005/UNDP and WBI Morteza Rahmatian, Iran: Cost Assessment of Environmental Degradation
LAND DEGRADATION: Rangeland • Iran’s rangelands total about 90 million hectares. • The main source of degradation is overgrazing. • There are about 46 million animal units in excess on rangelands. Table 1: Degradation of rangeland quality between 1975 and 2000 • Using a social discount rate of four percent and a 25-year time horizon, the net present value of the damage cost in 2002 amounts to US$ 172 million (Rials 1,400 billion).
LAND DEGRADATION: Wetland • Iran has 286 wetlands, twenty of which have been listed in the Ramsar Convention, covering 0.7 percent of the country’s territory. • The most serious threats to wetlands have been their drainage and reclamation for • agriculture and the diversion of water supplies for irrigation. • Many wetlands have been polluted with domestic sewage, herbicides, pesticides, fertilizers, industrial effluents and other waste products. • The report focuses on damages resulting from man-driven droughts. The value of damage is assessed by multiplying the total service value of a hectare of wetland by the total damaged area.
Table 2: Estimate of damage costs resulting from wetland degradation
LAND DEGRADATION: Wetland • Using a social discount rate of four percent and a 25-year time horizon, the net present • value of the damage cost in 2002 equals US$ 350 million (Rials 2,800 billions). Caspian EVE 2005/UNDP and WBI Morteza Rahmatian, Iran: Cost Assessment of Environmental Degradation
LAND DEGRADATION: Irrigated Agricultural Land Salinity • The irrigated agricultural land in Iran amounts to 7.4 million ha. Around 60% of this land suffer from different degrees of soil salinity. Table 3: Soil salinity on irrigated lands
LAND DEGRADATION: Irrigated Agricultural Land Salinity Table 4: Irrigated cropping patterns, salinity tolerance and yield decline
LAND DEGRADATION: Irrigated Agricultural Land Salinity Table 5: Estimated annual cost of soil salinity
LAND DEGRADATION: Floods & Soil Erosion • The number of floods recorded in the 1980s and 1990s is more than five times the number recorded in the 1950s and 1960s. • Forest clearing for agriculture, firewood and charcoal production reduced forest area from 19.5 million hectares to 12.4 million hectares over the last 57 years. • The country’s most damaging floods occur in the Caspian region. • Average annual losses: • - Human losses: US$ 23 million • - Damage to infrastructure: US$ 164 million • Total annual damage cost: US$ 187 million • One-fifth of the annual damage cost can be related to natural causes and four-fifths to man-made activities. This would amount to US$ 150 million (Rials 1,200 billion).
LAND DEGRADATIONTotal annual damage cost: US$ 2.8 billion Caspian EVE 2005/UNDP and WBI Morteza Rahmatian, Iran: Cost Assessment of Environmental Degradation
PM10 Based on existing and estimated level of PM10 in 7 cities in Iran: Tehran, Mashad, Isfahan, Shiraz, Tabriz, Ahwaz, and Karaj and using international D-R coefficients to combine concentration levels and baseline data on mortality and morbidity: 13,200 premature deaths 12,500 new cases of chronic bronchitis 28,600 hospitalizations 560,300 emergency room visits 1.6 millions restricted activity. days 263 million respiratory symptoms Lead Health Impacts IQ losses in children Mortality Morbidity Total costs: US$ 1.5 billion or Rials 12,000 billions (1.32% of GDP) Air–Urban air pollution (PM10 and lead)
Air–Indoor air pollution • International literature estimatesodds-ratiowhich relate the likelihood of contracting a disease if biomass fuel is used for cooking • 7.8%of Iranian households usebiomass for cooking. Impacts on: • Acute respiratory infections • Children: 552 deaths / 3 million cases of illness • Adult women: 726 deaths / 549 thousand cases of illness • Chronic obstructive respiratory disease • Adult women: 770 deaths / 2,200 cases of illness • Total costs: US$ 300 millions Rials 2,500 billions (or 0.28 % of GDP)
COASTAL ZONE: Loss in Fishery in the Caspian Sea Sturgeon Fishery: • Most of the world's caviar comes from sturgeon of the Caspian Sea. It is believed that about 90 percent of all the world's sturgeons swim in the Caspian. • The most pressing threat for sturgeon is widespread poaching throughout the Caspian • to feed the international demand for caviar. • Sturgeons are also under stress due to natural habitat degradation including: • - Reduced access to spawning grounds caused by the construction of large dams. - Destruction of natural spawning grounds due to quarry operations. - Chemical and organic pollution.
COASTAL ZONE: Loss in Fishery in the Caspian Sea Sturgeon Fishery: Figure 1: Sturgeon Catch in Iran (1978-2002)
COASTAL ZONE: Loss in Fishery in the Caspian Sea Sturgeon Fishery: • An average of 2,500 tons/year is used as the ‘best estimate’ of potential annual sustainable catch of sturgeon. Under this consideration, the loss of sturgeon catch for year 2002 would be 1,857 tons. • This is equivalent to a loss of 278 tons of caviar. At an average export price of $533/kg, this will result in a loss of around US$ 148 million (Rials 1,200 billions). • Numerous sturgeon hatcheries were created as mitigation for lost spawning habitat. 85 percent of Iranian sturgeon catches are related to fingerlings release. The production cost of each fingerling is US$ 0.50. With an average annual release of 22 million, this would result in a total cost of US$ 11 million.
COASTAL ZONE: Loss in Fishery in the Caspian Sea Kilka Fishery: • The kilka fishery is threatened by the comb jelly, an invasive species introduced • by the ballast water of ships traveling the Volga-Don canal. • The kilka fish catch decreased dramatically since 2000. The catch of 2002 presents 44 percent of the average annual catch between 1993 and1999. This results in a loss of US$ 6.8 million. Total Loss in Sturgeon and Kilka Fisheries for the Year 2002: US$ 166 million (Rials 1,300 billions).
Waste • Municipal waste: collection is 90 to 100 % (cities with more than 500,000 people, 70% (cities with pop between 25,000 to 500,000) and 50 to 60 % in rural areas. • WTP to improve waste collection and street cleaning varies $3.3 and $7.3/hshl/month. • Apply WTP to 5% (large cities), 30% of hshl of medium cities and 45% of rural households • Damage cost $235 million or 0.21% GDP • Unsanitary Landfills: comparison between the gate fee of two landfills (same size): • Current Kahrizak landfill serving Tehran “without” environmental consideration: gate fee $1/t (include waste reception, dumping, minimal soil cover, exclude land and profits). • Proposed Houshang landfill designed “with” environmental considerations: gate fee $4.7/t (incl. bottom liner, leachate collection and treatment, gaz collection, replanted vegetation, site closure). The difference $3.7 is applied to municipal waste generated. Damage cost $90 million or 0.08 % GDP
Waste Loss in Recreational Value Northern Provinces: 5 million tourists visit Northern provinces. 2 million tons of solid waste has been dumped in river banks considerably reducing aesthetic attractiveness of some areas. Based on study in Australia, a decline in environmental condition from “Unspoiled” to “Somewhere Spoiled” could reduce tourists expenditure by 30 %. Conservatively used 10 to 20 % reduction in tourists expenditures. Average expenditure $35/day and average time spent is 3 days. Potential decline in tourists revenue $75 million or 0.07% GDP No estimate of damage costs related to Hospital or Industrial waste Annual damage costs $400 million or Rials 3,200 billions (or 0.36% GDP)
Deforestation - WWF Ecological Regions in Gilan and Mazandaran Provinces Cleared Areas (GEF & IFPRI)
Deforestation Forest cover 12.4 million ha (7.4% country area). Estimated annual deforestation 125,000 ha/yr. Deforestation mainly due to conversion of land to agriculture and clear cutting for wood. Benefits loss due to deforestation: Direct Use Value: Timber. Timber only important in the Caspian Forest (45,000 ha deforested). MAI was 7m3/ha now 3m3/ha. Assume that half this figure is wood and the rest is firewood and an average stumpage price US$150/m3. Estimated annual loss of timber US$ 10 million (Rials 80 billions) Direct Use Value: Firewood. Firewood important in Caspian (45,000 ha), Zagros (54,000 ha) and Irano-Touranian (27,000 ha) regions. Considering MAI (ranging 0.4m3/ha to 1.5m3/ha) and the stumpage price in various forests ($ 4/ha, $7/ha and $30/ha). Estimated annual loss of firewood US$ 2.4 million (Rials 20 billion) Direct Use Value: Grazing and other NWFP.No reliable data was found on these values. We applied the results found in Turkey $20/ha/yr ($15 for grazing and $5 for other NWFP). Estimated annual loss US$ 2.5 million (Rials 20 billion)
Deforestation Direct Use Value: Hunting. Value found in Turkey $1/ha was used in Iran (valuation is based on the hunting permit price and license fees). While hunting occurs only in designated areas, this estimate represents an average value calculated. Estimated annual loss $125,000 (Rial 1 bill) Direct Use Value: Recreational.Based on the number of visitors to Caspian area and the recreational benefits in forest parks ($6/person/yr), we estimated the potential loss in recreational value due to deforestation at $6.5/ha/yr. Estimated annual loss $812,000 (Rials 6 billions) Indirect Use Value: Loss of plant nutrient. FAO reports that 46% of total soil erosion is due to deforestation (but this result of past deforestation). Conservatively assume that annual deforestation contributes to 1.8% of annual soil erosion (or 18 million t). This result in a loss in soil nutrient 73,000 tons. Valuation is based on replacement cost method ie using as proxy the cost of fertilizers necessary to substitute the loss of nutrients ($0.1/kg). Estimated annual costs of substituting nutrient $7.3 million (Rials 58 billions)
Deforestation Indirect Use Value: Protection of Water Reserves & Water Purification • Study in Iran estimates the benefits of forests in protecting underground water reserves about $17/ha Caspian Forest, $8/ha Zagros forest, $37/ha Irano-Touranian forests. Estimated annual loss of water protection $2 million (Rials 16 billions) • Indirect Use Value: Carbon Sequestration. Net emissions of CO2 from forestry sector is 31.5 million tCO2 Average price adopted by Carbon Market $13 - $18 tC. Estimated annual damage costs: $132 million (Rials 1,000 billions) • Option, Bequest and Existence Values. Option value of pharmaceutical products: no estimate found in Iran. Only estimate in the Mediterranean is Turkey $6.3/ha. Applying this estimate to Iran loss of $ 800,000. Biodiversity conservation: study in Iran assessed the annual benefits of biodiversity conservation to $16/ha in Caspian forests, $8/ha in Zagros and $16/ha in Irano-Touranian forests. An annual loss of $1.6 million NPV $900 million or Rials 7,000 billion (0.8% GDP)