Download
1 / 26
260 likes | 380 Views
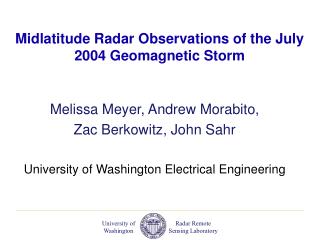
Modelling the Variability of Midlatitude Storm Activity on Decadal to Century Time Scales. Hans von Storch, Institute for Coastal Research, GKSS Irene Fischer-Bruns, Max Planck Institute for Meteorology Germany. Model & Experiments. Atmosphere-Ocean GCM ECHO-G

E N D
Modelling the Variability of Midlatitude Storm Activity on Decadal to Century Time Scales Hans von Storch, Institute for Coastal Research, GKSS Irene Fischer-Bruns, Max Planck Institute for Meteorology Germany The CRCES Workshop on Decadal Climate Variability
Model & Experiments • Atmosphere-Ocean GCM ECHO-G • Atmospheric Model ECHAM4 (T30) • (~3.75°x 3.75° ~300 km x 300 km) • Ocean Model HOPE-G (T43) • (~2.8°x 2.8° ~200 km x 200 km) • 2 Historical Simulations 1550-1990 • (time dependent solar / volcanic / GHG forcing) • 3 Future Climate Change Simulations • (CMIP2, SRES A2/B2) (152 resp. 110 years) • Control Simulation 1000 years • (present day conditions) The CRCES Workshop on Decadal Climate Variability
The millennial run generates temperature variations considerably larger than MBH-type reconstructions. The simulated temperature variations are of a similar range as derived from NH summer dendro-data, from terrestrial boreholes and low-frequency proxy data. The CRCES Workshop on Decadal Climate Variability
Reconstructed and simulated winter temperature anomalies in eastern China (Liu et al., 2005) The CRCES Workshop on Decadal Climate Variability
Reconstruction from historical evidence, from Luterbacher et al. Late Maunder Minimum Model-based reconstuction 1675-1710vs. 1550-1800 The CRCES Workshop on Decadal Climate Variability
External Forcing – Future Scenarios • IPCC SRES A2 and B2 emissions marker scenarios • A2 • Business as usual • B2 • Strong focus on environmental protection • Lower emissions – • less future warming The CRCES Workshop on Decadal Climate Variability
Applications so far • Methodical analysis of performance of MBH method and MM05 “AHS” mechanism.(von Storch, H., E. Zorita, J. Jones, Y. Dimitriev, F. González-Rouco, and S. Tett, 2004: Reconstructing past climate from noisy data, Science 306, 679-682;von Storch, H., and E. Zorita, 2005: Comment to "Hockey sticks, principal components and spurious significance" by S. McIntyre and R. McKitrick, Geophys. Res. Lett. (in press) doi:10.1029/2005GL022753) • Simulation of Late Maunder Minimum – regional European or near-global phenomenon(Zorita, E., H. von Storch, F. González-Rouco, U. Cubasch, J. Luterbacher, S. Legutke, I. Fischer-Bruns and U. Schlese, 2004: Climate evolution in the last five centuries simulated by an atmosphere-ocean model: global temperatures, the North Atlantic Oscillation and the Late Maunder Minimum. Meteor. Z. 13, 271-289) • Comparison with multidecennial Chinese temperatures(刘 健 , H. von Storch, 陈 星, E. Zorita, 郑景云, and 王苏民, 2005: 千年气候模拟与中国东部温度重建序列的比较研究 (Comparison of simulated and reconstructed temperature in eastern China during the last 1000 years), Chinese Science Bulletin, in press) • Low frequency variability in temperature modes and Extratropical storminess(Zorita, E., F. González-Rouco, H. von Storch, J.P. Montavez und F. Valero, 2005: Natural and anthropogenic modes of surface temperature variations in the last millennium, Geophys. Res. Letters 32, L08707Fischer-Bruns, I., H. von Storch, F. González-Rouco and E. Zorita, 2005: Modelling the variability of midlatitude storm activity on decadal to century time scales. Clim. Dyn. DOI 10.1007/s00382-005-0036-1) The CRCES Workshop on Decadal Climate Variability
North Atlantic Storminess: Observational results • Worsening of storminess in NAtl since a minimum in • the 1960s consistent with NAO changes • No significant changes over last 100 years (WASA, 1998) • Different storm indicators from pressure readings • 1780/1820-2000 No evidence of long-term trend • (Bärring & von Storch, GRL, 2005.) 12 hourly pressure changes exceeding 16 hPa / 12h Lund Stock- holm The CRCES Workshop on Decadal Climate Variability
Model & Experiments • Atmosphere-Ocean GCM ECHO-G • Atmospheric Model ECHAM4 (T30) • (~3.75°x 3.75° ~300 km x 300 km) • Ocean Model HOPE-G (T43) • (~2.8°x 2.8° ~200 km x 200 km) • 1 Historical Simulation1550-1990 • (time dependent forcing) • 3 Future Climate Change Simulations • (CMIP2, SRES A2/B2) (152 resp. 110 years) • Control Simulation 1000 years • (present day conditions) The CRCES Workshop on Decadal Climate Variability
Simulated data10m maximum wind speed • diagnosed at every grid-point and at every time step • stored every 30 minutes • output every 12 hours Extreme wind speed events per season ( 8 Bft, gales ) were counted The CRCES Workshop on Decadal Climate Variability
Model Study • Analysis of different model experiments • with respect to gale frequency • Determination of simple indicators • describing storm activity Storm Intensity Index Storm Shift Index The CRCES Workshop on Decadal Climate Variability
Mean number of gale days (10m wind speed reaching at least 8 Bft) in the northern winter season DJF (left) and in the southern winter season JJA (right) for the pre-industrial period 1551-1850 in the historical experiment (upper panels) and mean number of storm days (10m wind speed reaching at least 10 Bft, lower panels). The CRCES Workshop on Decadal Climate Variability
Mean number of gale days (10m wind speed reaching at least 8 Bft) in the northern winter season DJF (left) and in the southern winter season JJA (right) for the industrially influenced period 1851-1990 in the historical experiment. The CRCES Workshop on Decadal Climate Variability
Mean number of gale days (10m wind speed reaching at least 8 Bft) in the northern winter season DJF (left) and in the southern winter season JJA (right) during the last 300 years of the control run of 1000 years length. The CRCES Workshop on Decadal Climate Variability
Mean number of gale days (10m wind speed reaching at least 8 Bft) in the northern winter season DJF (left) and in the southern winter season JJA (right) in the A2 climate change experiment. The CRCES Workshop on Decadal Climate Variability
Storm Intensity A2 – pre-industrial industrial – pre-industrial DJF JJA The CRCES Workshop on Decadal Climate Variability
Storm Intensity Mean number of gale-days averaged over time and region Storm intensity index = plain storm count pre-ind ind A2 NH: no change SH: increase Storm Intensity Index The CRCES Workshop on Decadal Climate Variability
Storm Intensity Mean number of galedays averaged over time and region pre-ind ind A2 pre-ind ind A2 (90W-30E) (150E-90W) N Atl: increase N Pac: decrease NH: no change SH: increase Storm Intensity Index The CRCES Workshop on Decadal Climate Variability
Storm Shift 23.4 % NAtl (DJF) y = 0.20x+20.7 +95% 26.5 % NPac (DJF) y = -0.18.x + 34.1 -53% SH (JJA) 11.2 % y = 0.22x + 26.5 + 84% Pattern of slope coefficient in A2 The CRCES Workshop on Decadal Climate Variability Leading EOFs pre-ind
Storm Shift Storm Shift Index pc1 pc4 NAtl (DJF) NPac (DJF) SH (JJA) The CRCES Workshop on Decadal Climate Variability EOFs pre-ind PCs obtained by projection onto EOF
Warming and Storms N Atlantic NAtl Temp Storm Intensity Index Storm Shift Indices N Atlantic Warming and Storms pc1 pc4 Poleward shift (NE) Intensity: slight increase N Pacific NPacTemp Storm Intensity Index Storm Shift Index Temp & Indices: No correlation in pre-industrial period Poleward shift Intensity: decrease (11-yr running mean) The CRCES Workshop on Decadal Climate Variability
Warming and Storms Southern Hemisphere SH Temp Storm Intensity Index Storm Shift Index Intensity: sharp increase Poleward shift (11-yr running mean) The CRCES Workshop on Decadal Climate Variability
Conclusions – long term simulation • Historical runs done. • Realistic sequence of warming and cooling. • Variations larger than in multi-proxy regression-type reconstructions, but consistent with other reconstructions and some regional data. Hans von Storch The CRCES Workshop on Decadal Climate Variability
Conclusions - storms • Analysis of long-term model data with respect to wind speed extremes; Determination of two simple indicators describing storm intensity and storm track location. • The storm indices show no trends in the historical experiments, except for SH in 20th century. • NH Temperature and Storm activity are uncorrelated in the pre-industrial period • Future climate change scenario A2: - Parallel increase of storminess indices and temperatures.- Poleward shift of the region with maximum gale intensity for NAtlantic (NE), NPacific and SH; Storm intensity is constant over the NH as a whole, but increasing in the Atlantic region and decreasing in the Pacific - Increase of storm intensity for SH Irene Fischer-Bruns The CRCES Workshop on Decadal Climate Variability