Download
1 / 18
180 likes | 255 Views
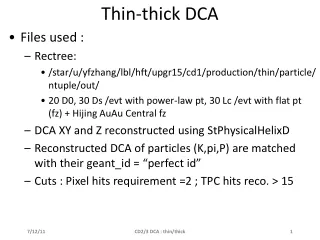
In the next slides, I look at some variables ( possible cut variables ) in real data ( day109 – the light root file from this production ) and pure data ( power law pt ).

E N D
In the next slides, I look at some variables (possible cut variables) in real data (day109 – the light root file from this production) and pure data (power law pt) Since I used the pico file from this production, the real data distributions reflect the cuts we used (eg. Only +ve decay lengths)
Transverse DCA to PV PureD0 Kaon Pion Real Data Kaon Pion
σDCAXY PureD0 Kaon Pion Real Data Pion Kaon
DCAXY/σDCAXY PureD0 Real Data Kaon Pion Motivation: http://www.star.bnl.gov/~bouchet/TCFIT/L_over_dl_cut_mix.ppt.htm
DCAXY after cut |DCAXY/σDCAXY|>1 PureD0 Real Data Kaon Pion With a cut on DCAXY/σDCAXY > 1, entries with low DCAXY are removed.
Decay Length with no offline cuts PureD0 Real Data We have cut slength>0 in the pico file
Error of decay Length PureD0 Real Data
dL/σdL PureD0 Real Data
dL with a cut dL/σdL > 1 PureD0 Real Data With a cut dL/σdL > 1 the low values (~ below 100μm) of slength is removed.
Probability of TcFit PureD0 Real Data Probability Vs TrackDcaKpi
Cutting on probability D0 Mass pure with a cut on DcaKpi < 0.03 D0 Mass pure The bottom plots show D0 Mass distribution from pure data for different probability cuts. The bottom right plot combines a cut on probability and TrackDcaKpi (< 300um). The cuts prob > 0.05 and prob > 0.1 doesn’t seem to make much difference as far as cleaning up the signal.
Eta of the Parent (D0) PureD0 Real Data |EtaD0|<1.85 may be tried as we did with last production
dEdx Pion Kaon With a cut |ndEdx|<2 With a cut |ndEdx|<2 K and π bands with |nσ| < 1.5 With the new momentum dependent cut on dEdx we are retaining much more candidates. I think the current cut |nSigma|<2 would be good enough.
Eta of the Parent (D0) PureD0 Real Data |EtaD0|<1.85 may be tried as we did with last production
Possible cuts to use in pico file * New/changed cuts • Create a pico file with: • |Cos(θ*)|<0.6 • |EtaD0|<1.85 • |ndEdx|K < 2, |ndEdx|π < 2 • |RapidityD0| < 0.5 • Probability > 0.05 • ChargeK*ChargePi <0