Download
1 / 29
290 likes | 365 Views
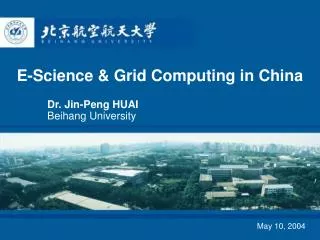
Global Hydrology Modelling: Running Multiple Ensembles with the Campus Grid. Simon Gosling Walker Institute for Climate System Research, University of Reading Thanks to Dan Bretherton (Reading e-Science Centre) and Nigel Arnell (Walker Institute). Outline.

E N D
Global Hydrology Modelling: Running Multiple Ensembles with the Campus Grid Simon Gosling Walker Institute for Climate System Research, University of Reading Thanks to Dan Bretherton (Reading e-Science Centre) and Nigel Arnell (Walker Institute)
Outline • The hydrological model & project background • Projected changes in global annual runoff • Projected changes in seasonal runoff • Projected changes in global water resources stresses
The hydrological model: Mac-PDM Mac-PDM is written in Fortran and simulates river flows across the globe on a 0.5x0.5 degree grid. Input data from global climate models (GCMs): Rainfall Temperature Humidity Windspeed Cloud cover
The NERC QUEST-GSI project • Aim is to examine the global scale impacts of climate change on the hydrological cycle and water resources. • If global temperature was to rise by a certain amount, what would the impacts be? • Investigate impacts for the following 9 prescribed mean global temperature changes relative to present: • +0.5ºC • +1.0 ºC • +1.5 ºC • +2.0 ºC • +2.5 ºC • +3.0 ºC • +4.0 ºC • +5.0 ºC • +6.0 ºC
The NERC QUEST-GSI project • The climate data is taken from an ensemble of GCMs to explore the role of climate model structural uncertainty. Source: Collins et al. (2006) Towards quantifying uncertainty in transient climate change. Climate Dynamics 27: 127-147
Running on the campus grid Prescribed Temperature Running on Linux Desktop: 1 run = 3 hours 9 runs = 27 hours 171 runs = 513 hours (21 days) On the campus grid: 171 runs = 9 hours 0.5 1.0 1.5 2.0 2.5 3.0 4.0 5.0 6.0 UKMO HadCM3 x x x x x x x x x CCCMA CGCM31 x x x x x x x x x IPSL CM4 x x x x x x x x x MPI ECHAM5 x x x x x x x x x NCAR CCSM30 x x x x x x x x x BCCR BCM20 x x x x x x x x x CCCMA CGCM31T63 x x x x x x x x x GCM used to provide climate data CCSR MIROC32HI x x x x x x x x x CCSR MIROC32MED x x x x x x x x x CNRM CM3 x x x x x x x x x CSIRO MK5 x x x x x x x x x GFDL CM21 x x x x x x x x x GISS AOM x x x x x x x x x GISS MODELEH x x x x x x x x x GISS MODELER x x x x x x x x x IAP FGOALS10G x x x x x x x x x INM CM30 x x x x x x x x x MRI CGCM232A x x x x x x x x x UKMO HadGEM1 x x x x x x x x x
Multiple ensembles for various prescribed temperature changes 18 model runs 81 model runs 9 model runs Sign of change varies by GCM
The challenge of summarising the results The ensemble mean But there are issues with the ensemble mean
The challenge of summarising the results Number of models in agreement
Projected Changes in the Seasonal Cycle of Average RunoffMekong Basin&Liard Basin
The Mekong Changes in sign vary by GCM. Magnitude of changes increase with temperature
Calculating stresses • A region is stressed if water availability is less than 1000m3/capita/year • Therefore stress will vary acording to population growth: • Stress calculated for 3 populations scenarios • SRES A1B • SRES A2 • SRES B2 • Stresses calculated for the 2050s with different prescribed warming (0.5-6.0ºC)
Global water resources stresses IPSL CM4 HadCM3 CCSR MIROC32HI
Global water resources stresses IPSL CM4 HadCM3 CCSR MIROC32HI
Global water resources stresses Little uncertainty due to population change but much due to GCM choice
Summary and Conclusions • Use of the campus grid has reduced run time from 21 days to 9 hours • This allows a comprehensive investigation of climate change impacts uncertainty • Results demonstrate: • GCM structure is a major source of uncertainty • Sign and magnitude of runoff changes varies across GCMs • For water resources stresses, population change uncertainty is relatively minor
Thank you for your time Visit www.walker-institute.ac.uk