Download
1 / 19
190 likes | 344 Views
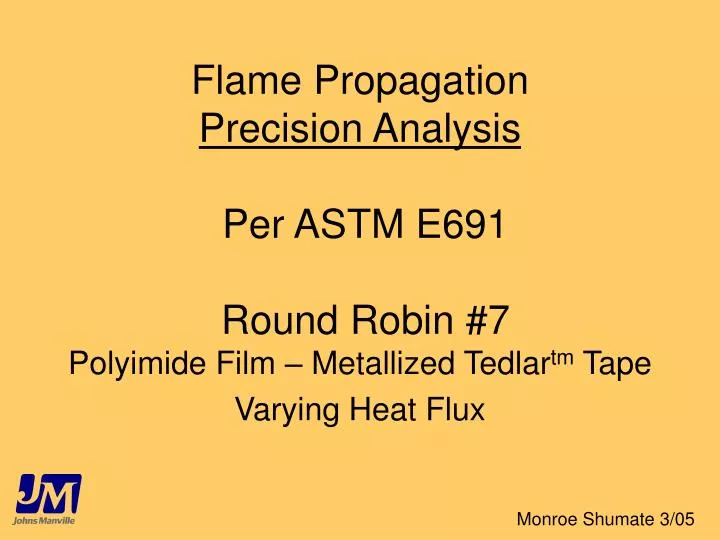
Flame Propagation Precision Analysis Per ASTM E691 Round Robin #7 Polyimide Film – Metallized Tedlar tm Tape Varying Heat Flux. Monroe Shumate 3/05. ASTM E691 Precision Analysis Practice for conducting an inter-laboratory test program to determine precision of a test method.

E N D
Flame PropagationPrecision Analysis Per ASTM E691 Round Robin #7Polyimide Film – Metallized Tedlartm Tape Varying Heat Flux Monroe Shumate 3/05
ASTM E691 Precision Analysis Practice for conducting an inter-laboratory test program to determine precision of a test method Practice has been in use for over 25 years
Purpose of an Inter-laboratory Study • Primary – Provide information to prepare precision statement on test method • Secondary- Provide suggestions where to look for improvements to test method
What is precision ? Goal Good AccuracyGood Precision Poor AccuracyGood Precision Good AccuracyPoor Precision Poor AccuracyPoor Precision
So what’s measured and reported? • Xbar - Cell Average • SX - Standard Deviation (Stdev) cell averages • Sr – Repeatability Stdev with-in lab variation • SR- Reproducibility Stdev between lab variation • r - Repeatability limit (95% confidence = 2.8*Sr) • R – Reproducibility limit (95% confidence = 2.8*SR)
What does this data show? • X bar shows average value for this sample/test • Sx shows how much the values will vary • Sr shows within lab variation as compared to other labs • SR shows between lab variation • r - Within lab max. variation or noise • should be 1/4 of the spec limit • R – Between labs max. variation or noise • should be 1/4 of the spec limit
Test Data Round Robin 7Sample Description & Test Setup • Polyimide Facing • Metallized Tedlar Tape • Fiber Glass AA class – 0.34 pcf • Test at 3 heat flux settings
Lab Participation • 10 Labs • 5 samples/lab
Equipment & Setup • Electric and Gas Radiant panels • Set up according to FAR Standard with exception to heat flux • Set up performed by each lab
Reporting Results • Record heat flux, room temperature, relative humidity, controller temperature settings • Report • Flame Propagation • After Flame
ASTM Analysis • Input raw data from round robin • Determine average, deviation, and standard deviation for the following: • For each lab • For all labs combined • Compare individual labs to all labs
Initial Test ResultsOne Set of Raw Data Using this data lets perform precision analysis a b c d g h i j
Initial test resultsOne set of data Spec Limit – 3 sec max. So How does this look?
Initial test resultsOne set of data Is X bar (Average) ok? Spec Limit – 3 sec max.
Initial test resultsOne set of data Spec Limit – 3 sec max. How is X bar when you consider Sx or variation?
Initial test resultsOne set of data Spec Limit – 3 sec max. Now for the ultimate question how doesthe spec limit compare to r or R? Is R ¼ of the spec limit?
Precision analysis – All data Remember R should be ¼ of spec
Conclusion • Test method is not precise for the type of sample tested(Need to analyze other types of samples) • Both within and between lab variation needs to be addressed – this points to both the equipment and operator
Recommendation • Continue FAA lab inspection process to refine equipment setups for each lab – then repeat round robin • Conduct precision analysis for other types of samples • Conduct FMEA – failure mode effect analysis – to list & prioritize possible areas for evaluation and improvement • Use data from FMEA to conduct ruggedness test (ASTM E1169) or DOE Optimize equipment/operator specs Monroe Shumate 3/05