Download
1 / 29
290 likes | 385 Views
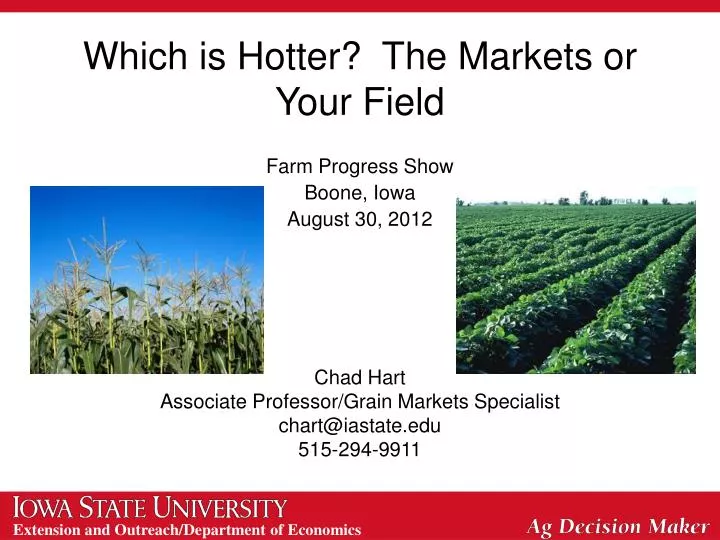
Which is Hotter? The Markets or Your Field. Farm Progress Show Boone, Iowa August 30, 2012 Chad Hart Associate Professor/Grain Markets Specialist chart@iastate.edu 515-294-9911. U.S. Corn Supply and Use. Source: USDA-WAOB. U.S. Soybean Supply and Use. Source: USDA-WAOB. Prices.

E N D
Which is Hotter? The Markets or Your Field Farm Progress Show Boone, Iowa August 30, 2012 Chad Hart Associate Professor/Grain Markets Specialist chart@iastate.edu 515-294-9911
U.S. Corn Supply and Use Source: USDA-WAOB
U.S. Soybean Supply and Use Source: USDA-WAOB
Crop Conditions Source: USDA-NASS
Objective Corn Yield Data Source: USDA-NASS
World Corn Production Source: USDA-WAOB
World Soybean Production Source: USDA-WAOB
Hog Crush Margin The Crush Margin is the return after the pig, corn and soybean meal costs. Carcass weight: 200 pounds Pig price: 50% of 5 mth out lean hog futures Corn: 10 bushels per pig Soybean meal: 150 pounds per pig Source: ISU Extension
Cattle Crush Margin The Crush Margin is the return after the feeder steer and corn costs. Live weight: 1250 pounds Feeder weight: 750 pounds Corn: 50 bushels per head Source: ISU Extension
U.S. Meat Production & Prices Source: USDA-WAOB
Corn Exports Source: USDA-FAS
Soy Exports Source: USDA-FAS
Corn Advance Export Sales Source: USDA-FAS
Soy Advance Export Sales Source: USDA-FAS
Ethanol Stocks Source: DOE-EIA
U.S. Blended Gasoline Consumption 7.6 bil. gal. 7.4 bil. gal. Source: DOE-EIA, via USDA-ERS
Current Corn Futures 7.54 6.15 5.58 Source: CME Group, 8/29/2012
Current Soybean Futures 16.09 12.86 12.35 Source: CME Group, 8/29/2012
Thoughts for 2012 and Beyond • Supply/demand concerns • We got some rain, too little, too late • Biofuel growth and energy demand, RFS? • Will supply be able to keep pace with demand? • Drought is pulling supply down • But high prices are diminishing demand • General economic conditions • Continued worldwide economic recovery is a key for crop prices • US job recovery, European financial concerns, China? • 2012/13: USDA: Corn $8.20; Soy $16.00 Futures (as of 8/29/12): Corn $7.54; Soy $16.09 • 2013/14: Futures Corn $6.15; Soy $12.86 • 2014/15: Futures Corn $5.58; Soy $12.35
Thank you for your time!Any questions?My web site:http://www.econ.iastate.edu/~chart/Iowa Farm Outlook:http://www.econ.iastate.edu/ifo/Ag Decision Maker:http://www.extension.iastate.edu/agdm/