Download
1 / 33
350 likes | 863 Views
Imaging and genetic biomarkers of Parkinson disease onset and progression . K Marek Institute for NeuroDegenerative Disorders May 7, 2010. Consultant - Bayer Healthcare, GE healthcare, Boehringer Ingelheim, Eli Lilly, Biogen Idec Owner Molecular NeuroImaging. Disclosures.

E N D
Imaging and genetic biomarkers of Parkinson disease onset and progression K Marek Institute for NeuroDegenerative Disorders May 7, 2010
Consultant - Bayer Healthcare, GE healthcare, Boehringer Ingelheim, Eli Lilly, Biogen Idec Owner Molecular NeuroImaging Disclosures
Disease Mechanism Drug Mechanism/Drug dosage Improve diagnostic accuracy (enrich a study population) Identify subsets that might develop clinical outcomes Identify subsets that might respond to therapy Repeated measure to assess progression Eliminate confounding of symptomatic therapy Reduced sample size and more rapid assessment of effect -reduce cost and improve efficiency of clinical studies Evaluate efficacy of disease modifying therapeutic Assist in regulatory approvals Measurement prior to onset of motor symptoms Used to correlate with genetic and ‘omic’ biomarkers Provide objective quantitative outcomes at multiple clinical sites WHAT DOES IMAGING OFFER
Natural History of PDNo Treatment Symptomatic Diagnosis Neuron Function Clinical Ratings Pre-Motor Time
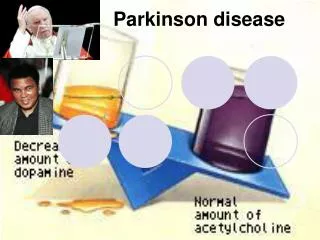
D2 receptors IBZM, raclopride
DAT/F-Dopa imagingState and Trait Biomarker for PD Nigral Dopamine loss - Face validity Reduction in early PD 50% Put Reduction Put>Caud Yes Reduction asymmetric Yes Correlation with severity Yes (UPDRS) Reduction in Presymtomatic Yes (Hemi-PD) Monitor PD progression Yes
CALM - CIT REAL PET-FDopa Pelmopet - FDopa ELLDOPA - CIT Riluzole-FDopa GPI 1485 - CIT Precept - CIT Neuroimaging of PD Progression-
% Striatal Change in CIT uptakePlacebo Study Dur DX Interval Baseline % change PRECEPT 8 mo 22 mo (n=155) -7.2+11.2 GPI 23 mo 24 mo (n=99) -7.8+10.2
PRECEPT Baseline Comparison by Assigned Treatments
Scans < 75% Age adjusted Healthy subjects DAT Deficit Scans without evidence of deficit (SWEDD) SWEDD
PRECEPT study - FOLLOWUP IMAGING AND CLINICAL OUTCOMES BY SWEDD STATUS AT BASELINE Mean (SD) for Change in [123I] ß-CIT and UPDRS, Percent (CI) for need for DA treatment. * indicates p < 0.01
PreCEPT Baseline Scans as Predictors of PostCEPT Continuous Measures at Last Visit Parameter estimates (95% confidence intervals) and p-values from separate multiple regressions adjusted for baseline age, gender, duration of disease, and PreCEPT treatment. Use of dopamine agonists and levodopa at last visit included in models.
PreCEPT Baseline ß-CIT Uptake as Predictors of PostCEPT Endpoints N=491 (91% of 537) Odds Ratios (95% confidence intervals) from separate logistic regressions adjusted for baseline age, gender, duration of disease, and PreCEPT treatment. Analyses of SE/ADL are also adjusted for the baseline SE/ADL. Use of dopamine agonists and levodopa at last visit included in models.
Natural History of PDNo Treatment Symptomatic Diagnosis Neuron Function Preclinical Clinical Ratings Time
PPMI: Identify a tool or combinations of tools to inform PD clinical trial design and decisions PPMI comprises four core objectives • Develop/collect comprehensive clinical/imaging dataset and biological samples, which is made available • Establish standardized protocols for acquisition, transfer and analysis of clinical, imaging and biologic data • Conduct preliminary verification and validation studies on imaging and biologic markers • Identify and correlate clinical, imaging and biologic markers for use in future trials.
PPMI Overview • PPMI is a study to establish PD progression biomarkers – not a treatment trial • Intensive, comprehensive project for subjects, sites, investigators • Established study instruments complemented by novel technologies. Flexibility in incorporating new technologies and new studies • Openness to provide data to community • Set standards for biomarker collections and image acquisition 17
Natural History of PDNo Treatment Symptomatic Diagnosis Neuron Function Clinical Ratings Preclinical Time ‘PRE-MOTOR’
Biomarkers for PD Clinical markers Imaging –Phenotomics SPECT/PET-Dopamine - DAT, F-Dopa, VMAT2 SPECT/PET-non-dopamine FDG, MIBG, NE, 5HT, Nicotine, Ach, PBR, Amyloid, å-synuclein MRI-DTI Functional MRI Nigral Ultrasound Cognition Affective Depression Apathy Anxiety Autonomic Constipation Bladder Sexual Cardiac Olfaction Sleep - RBD Skin Motor analysis Speech Genetics Synuclein, LRRK2 Parkin DJ-1, Pink1 • Laboratory • Synuclein, DJ1, Tau, Amyloid, urate • RNA profiling • Metabolomics
Parkinson’s Disease Associated Risk Syndrome Subtle motor features Non-motor features Neuroimaging changes Genetic predisposition
Model for PD Screening Study Population Primary Screen-Sensitivity (Genetics, “Omic” Non-motor) Secondary Screen-Specificity (Imaging) ‘Gold Standard’ Clinical F/U
PARS Study DesignPhase I: Recruitment and Olfactory Testing Phase II: Longitudinal Clinical and Imaging Study Subset for mail follow-up N= Unaffected family members Eligible Relatives and non-relatives N=10,000 Hyposmics clinical and imaging visit n=300 Repeat UPSIT, SRQ, clinical visit Clinical and Imaging visits Normosmics Mailings, Advertising, Web, etc clinical and imaging visit n=100 Repeat UPSIT, SRQ, clinical visit Clinical and Imaging visits BL yr1 yr2
Current PARS Recruitment P A R S Current Enrollment* PD Patients recruit relatives, advertising/letters non-relatives Eligible subjects sent UPSIT’s (n=8,885) (72% return rate) 53% returned Valid UPSIT’s (n=4,676) ( Olfactory loss (n=574) (< 15% percentile) *As of 2/1/2010 Clinic Visits Completed: 349Imaging Visits completed:270
Baseline DAT Uptake in Imaging cohort P A R S N= 270
Start with a genetically defined cohort Several LRRK2 carrier cohorts – combined with imaging and olfaction Initial studies shows - Aysmptomatic LRRK2 carriers 4 subjects had reduced DAT during a 4 year period 2 of these had abnormal VMAT2 None had abnormal F-dopa Possible to detect imaging changes in this pre-motor group Compensation may occur that differentially effects these imaging outcomes Adams JR, van Netten H, Schulzer M, et al. PET in LRRK2 mutations: comparison to sporadic Parkinson's disease and evidence for presymptomatic compensation. Brain 2005;128:2777-2785.
LRRK2 AJ consortium LRRK2 15-20% of PD in Askenazi Jewish population - 3 sites – Tel aviv, Beth Israel, Columbia Penetrance uncertain/varied age of onset Cannot distinguish from IPD DAT imaging of unaffected carriers to examine pre-diagnostic period.
Stiasny-Kolster K, Doerr Y, Moller JC, et al. Combination of 'idiopathic' REM sleep behaviour disorder and olfactory dysfunction as possible indicator for alpha-synucleinopathy demonstrated by dopamine transporter FP-CIT-SPECT. Brain 2005;128:126-137.RBD a/w olfactory loss3/11 with FP-CIT SPECT showed reduction in DAT density Reduction in FP-CIT ratio in subject with RBD compared to controls
Natural History of PDNo Treatment Symptomatic Diagnosis Neuron Function Clinical Ratings ‘Pre-Diagnostic’ Time
Progression of PD Neurodegeneration • Begins in the Dorsal Medulla and Olfactory tract • Progresses upward through the brainstem • Cortical involvement begins in the anteromedial temporal cortex and progresses through the limbic cortices into the higher order sensory association and prefrontal cortices and finally to primary sensory and motor cortices Braak et al.
The Parkinson Complex:Parkinsonism is Just the tip of the IcebergLangston, Ann Neurol, 2006
Non-dopaminergic Sytems Tracers targeting specific neuronal pathology Norepinephrine transporter, MIBG Serotonin transporter Nicotinic å4ß2 receptor Adenosine A2A receptor Muscarinic receptors Cholinergic transporter mGluR-1,5 Tracers targeting disease pathophysiology FDG ß - Amyloid Synuclein Peripheral benzodiazepine receptor in microglia Tau
Imaging in PD Future Challenges • Preclinical detection – can we identify at risk cohorts to test neuropreventive therapies. • Determinants of variability in onset and progression -rapid vs slow progressors -risk factors for disease progression -subsets of patients • Novel imaging targets enabling multi-ligand imaging of pathobiology and drug monitoring.