Download
1 / 21
210 likes | 320 Views
Analysis Examples and Issues: Identifying Sources. Policy Analysis Tools for Air Quality and Health A workshop hosted by NERAM and Pollution Probe Jeffrey R. Brook May 19, 2005 TORONTO. Two Key Goals of AQ Research: ( for Policy Analysis). Improve understanding of health effects

E N D
Analysis Examples and Issues: Identifying Sources Policy Analysis Tools for Air Quality and Health A workshop hosted by NERAM and Pollution Probe Jeffrey R. Brook May 19, 2005 TORONTO
Two Key Goals of AQ Research:(for Policy Analysis) • Improve understanding of health effects • main pollutants and/or sources of concern • quantify concentration-response functions • Identify main sources contributing to the problem • quantitative source apportionment with uncertainties • develop predictive AQ models and integrate with cost-benefit models
Turning Research into Results • Research seems to be "never-ending"(and it could be) • How do we move forward in the near-term with practical solutions or applications given incomplete information, uncertainties or resistance to change? • What's important for the long-term? • Detailed analysis of measurement data provides useful insight • "receptor methods"
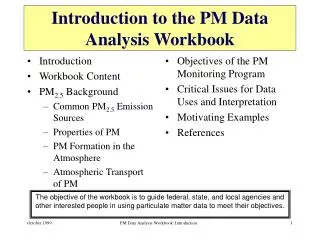
Presentation Outline • Some examples of recent analyses of PM-related measurement data • Results that have relevance to AQ management (hopefully) • Examples from basic to increasingly complex measurements • Final remarks
How much PM2.5 is from local emissions? Toronto area 1998-2001 warm season concentrations all matched in time Median six-hour PM2.5 (mg/m3)
EGBERT ~18 mg/m3 Decreasing Regional PM2.5 Estimating Regional Background:Comparison of sites
Local Contribution to PM2.5:Will local actions have an impact? • SW Flow: Simcoe to Toronto • Emissions/formation in Toronto add about 4 g/m3 to the regional air mass (containing ~18 mg/m3) before it arrives in North York • 30-37% of fine particle concentrations in Toronto are locally produced
60 50 Winter Annual Summer 50 36 35 40 26 30 Mass % 23 21 17 15 20 13 13 10 8 8 6 10 3.3 2.3 2.2 2.0 1.3 1.2 2.1 1.3 1.6 1.1 0 Secondary Ammonium Vehicle / Vehicle / Organic PMprimary-1 Smelter PMprimary-2 Coal Nitrate Road dust NaCl Acids Ammonium Nitrate Coal Combustion Motor Vehicles PMF Estimates of PM2.5 Sources - Toronto Sec. org.
Identifying source types and quantifying their contributions to PM: • Formulate conceptual model • Compile emission inventory • Characterize source emissions • Analyze ambient samples for mass, elements, ions, and carbon and other components from sources • Confirm source types with multivariate model • Quantify source contributions
Identifying source types and quantifying their contributions to PM: • Estimate profile changes and limiting precursors • Apply source-oriented models • Develop scenarios for source-oriented model (CTM) runs • Reconcile source contributions from the receptor models with other data analyses, with the inventories and with source models
Should policies to improve outdoor AQ through CWS achievement also be maximizing public health benefits?
Of Course ! Exposure should then be considered For particles, the relative health impact of different sources or physical-chemical characteristics should be considered
a b c d Profile plots of personal PM2.5 exposures, outdoor PM2.5 levels (a), and personal exposures to SO42- (b), EC (c), and Ca2+ (d). This subject spent an average of 4 hours in a car each day for the duration of the study. The rest of the time was spent mostly in an office (7 hours) and at home (13 hours). The Spearman’s correlation coefficient is largest for the association between personal exposures to PM2.5 and EC.
a b c d This subject spent an average of 21 hours at home each day for the duration of the study. The Spearman’s correlation coefficient is largest for the association between personal exposures to PM2.5 and outdoor PM2.5.
Sources of personal PM2.5 exposure • Relative contributions to personal exposure were regional haze (17%±16%), combustion (13%±10%), and local dust (7%±6%) • Traffic played a larger relative role in influencing personal exposures compared to ambient PM2.5 • 60% of personal exposure to PM2.5 could not be linked to the three source categories • The unknown sources are most likely due to indoor sources and/or something strongly linked to what the subjects did each day
Size of acute cardiovascular response is most-related to organic carbon Brachial Artery Diameter Diastolic Blood Pressure
401 Windsor to Toronto Ultrafine particles near and on roads Number per cubic centimeter Windsor Busy Roads
Concluding Remarks ... • Is there a direct link between research and actual air quality policies? • At some level - yes • Measurement-based AQ research can provide information of relevance to policy • the more-specific the question, the more-specific the study • Capability to identify sources and characterize AQ could be out-stripping health knowledge • Thus, more research (health) is needed (?)
Research is only 1 part of the solution • New policies to manage AQ often arise when there is an opportunity • Creating opportunities and having sensible, science-based policies ready to employ is important • research draws attention to potential problems and provides a science base • public education, directly and via health care practitioners • grass-roots pressure • Sensible AQ management actions are known • energy conservation/efficiency • urban and transportation planning • Strengthen association between good environmental practices and improved profits and sustainability