Download
1 / 20
200 likes | 357 Views
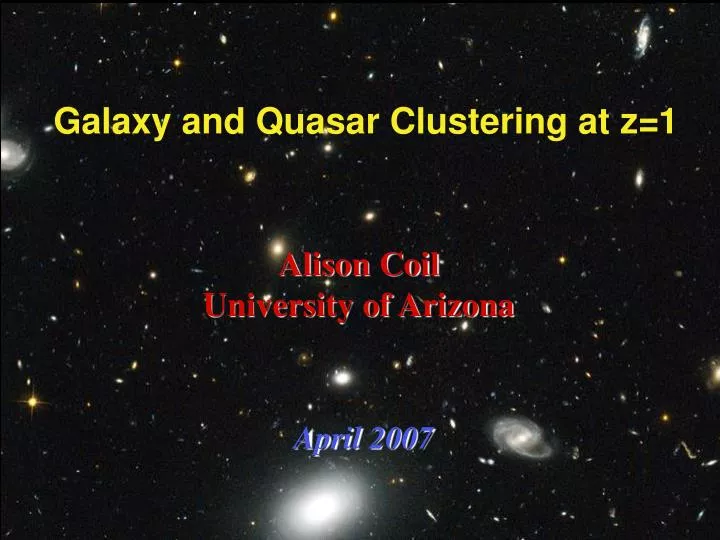
Galaxy and Quasar Clustering at z=1. Alison Coil University of Arizona. April 2007. Large-Scale Structure. SDSS :. Why do galaxies cluster? initial fluctuations in early universe gravity cosmology physics: galaxy formation Why high redshift? time leverage

E N D
Galaxy and Quasar Clustering at z=1 Alison Coil University of Arizona April 2007
Large-Scale Structure SDSS: • Why do galaxies cluster? • initial fluctuations in early • universe • gravity • cosmology • physics: galaxy formation • Why high redshift? • time leverage • earlier phase of galaxy • evolution • additional constraint on • models
DEEP2: A Redshift Survey at z=1 Collaboration b/w UC-Berkeley and UC-Santa Cruz using the DEIMOS spectrograph on the Keck II telescope to study both galaxy properties and large-scale structure at z=1. • Observational details: • 3 sq. degrees • 4 fields on sky • primary z~0.7-1.4 • ~7-9 Gyr ago • 40k redshifts • ~5·106 h-3Mpc3 • 80 Keck nights - 3 years • One-hour exposures • RAB=24.1 • high resolution - robust z’s Survey is done - data is released!
DEEP2 Redshift Survey: z=0.7-1.3 Cone diagram of 1/12 of the full DEEP2 sample
Clustering Primer • Quantify clustering: • probability of two galaxies separated by r • relative to a random unclustered distribution • large on small scales, small on large scales x(r) follows a ~power-law prescription locally: x(r) = (r0/r)g with r0~5 Mpc/h and g~1.8 r0 = scale where the prob. of a galaxy pair is 2x random larger r0 = more clustered
Clustering Primer Trace different physics on different scales: - small scales (r < 100 kpc/h): mergers + galaxy-galaxy interactions - intermediate scales (100 kpc/h < r < 2 Mpc/h): radial profiles of galaxies w/in halos / clusters - large scales (r > 2 Mpc/h): large-scale density field / cosmology / host dark matter halo mass
Galaxies Come in 2 Distinct Types Blue: star-forming, gas+dust, spiral, ‘late-type’ Red: non-star-forming, little gas/dust, elliptical, ‘early-type’ red sequence SDSS: Blanton et al. 2003 color blue cloud magnitude why? evolution? Bi-modal color distribution
DEEP2: same color bi-modality to z>1 red # density red gals blue bright faint redshift Build-up of red galaxies since z=1 - galaxies moving from blue cloud to red sequence. Willmeret al. 2006 ApJ / Faber et al. 2006 ApJ
Galaxy Clustering as a Function of Color Blue Red Red galaxies are more clustered and have larger velocity dispersion/fingers of god: reside in overdense environments + groups. Detect coherent infall on large scales for blue and red galaxies. First time this has been seen at z=1! Need precise z’s.
Galaxy Clustering as a Function of Color Color-density relation strongly in place at z=1. No color dependence w/in red sequence, but there is w/in blue cloud. Green galaxies as clustered as red. Which galaxies move to the red sequence by z=0? Redder of the blue cloud + green galaxies. green blue red (for MB<-20, L>L*, z=0.7-1.0) red:r0=5.17 (0.26) g=1.97 (0.04) blue:r0=3.83 (0.19) g=1.67 (0.05) Coil et al. in prep
Galaxy Clustering as a Function of Color Quantify minimum dark matter halos mass as a function of galaxy color (for MB<-20): red: b=1.6, Mhalo>2 1012 Mo/h blue:b=1.3,Mhalo>4 1011 Mo/h - important for color bimodality theories and simulations of gas accretion and star formation Color-density relation is not caused by clusters - very few clusters at z=1. Either caused by groups or intrinsic galaxy or halo property such as age/stellar mass/halo mass. The ‘green’ population is distinct - as clustered as red galaxies, but kinematics of blue galaxies. Shows infall on large scales - likely at the edges of groups/filaments and falling in. Likely a transition population moving to red sequence. Coil et al. in prep
QSO/AGN and Galaxy Evolution • QSO/AGN may be important in how galaxies evolve: • many/most galaxies have SMBH • mBH-sbulge relation • simulations: feedback from AGN or SNe is needed to shut off SF and create the color-mag diagram • mergers are needed to create ellipticals - may involve quasars as disk galaxies collide • Can test galaxy and QSO/AGN formation and evolution models with observed clustering
SDSS QSOs in DEEP2 fields 36 SDSS + 16 DEEP2 spectroscopic broad-line QSOs in the DEEP2 fields between z=0.6-1.4: DEEP2 SDSS (near M*)
Clustering of Galaxies around QSOs Cross-correlation of DEEP2 galaxies and SDSS QSOs. Errors include Poisson errors + cosmic variance. Similar errors as surveys with 1000s of QSOs (eg. 2dF). Divide by the clustering of DEEP2 galaxies around DEEP2 galaxies to get the bias of QSO hosts… Coil et al. 2007 ApJ
Relative bias of QSOs to DEEP2 galaxies QSO relative bias = 0.9 (0.2) QSO absolute bias = 1.2 (0.3) Cluster more like blue galaxies than red! (2s) ---not what is found locally at z=0. Constrains host type for QSOs (blue) and QSO host halo masses: Min. halo mass = 5x10¹¹ M0 Mean halo mass = 3x10¹² M0 No dependence is seen on magnitude or redshift. Coil et al. 2007 ApJ
Clustering of X-ray AGN in AEGIS Chandra survey in the EGS: 200 ks depth Have ~10,000 galaxies and ~200 (so far) X-ray sources w/ redshifts. Can measure the cross-correlation of X-ray AGN with galaxies. X-ray AGN hosts are bright and on red sequence or massive end of blue cloud. (even the faint ones: Lx~1042-44 erg/s, fx~1.5 x 10⁻¹⁵ erg/s/cm2) red color blue quasars z=0.7-1.4 -16 MB -24 Nandra et al. 2006 ApJL Barger et al. 2003 AJ
Clustering of X-ray AGN in AEGIS • First results: • significant dependence with optical luminosity:brighter AGN • (-20.5>MB>-23) are ~50% more • biased/clustered than fainter • AGN (-17.5>MB>-20.5) • -X-ray AGN cluster more like red • than blue galaxies • -cluster more than QSOs! • -redder X-ray AGN cluster more • than bluer AGN • -consistent w/ galaxies undergoing • a QSO phase before settling on the • red sequence w/ an AGN Coil et al. in prep
QSO/AGN Formation and Evolution • Competing QSO/AGN formation and evolution models predict different clustering properties, through assumed accretion and lifetimes: • - all begin with major mergers • Kauffmann and Haenelt 2001 predict a strong luminosity-dependence to QSO clustering: • assume an exponentially declining light curve, time=t • M_B ~ gas mass accreted / t • gas mass accreted ~ host halo mass • luminosity~halo mass brighter QSOs cluster more
QSO Formation and Evolution Lidz, Hopkins et al. 2005 predict less luminosity-dependence (but still some), as the light curve is not exponential - bright and faint QSOs are similar objects in same halos, but in different stages of their evolution - similar clustering - bias at z~1 is too high (b~2) - X-ray AGN cluster like quasars Croton et al. 2006 include a second mode for low-L AGN: if halo M > Mthreshold then no gas accretion (~5 1011 M0) - gas is shock heated, shuts off SF, creates color bimodality, shuts off black hole accretion - no QSO - but there is a low-L AGN - predict blue galaxies have QSOs at z<2 and red galaxies have low-L AGN - good qualitative agreement with our results! Clustering of QSOs constrains lifetimes, host halo mass, host galaxy type and differentiates between formation models.
Summary • Galaxies have a bimodal color distribution at z=1, similar to z=0. LF studies show that red galaxies have been forming since z=1. • Red galaxies are more clustered than blue galaxies at z=1, with a steeper slope and stronger fingers of god. • Galaxies that are likely to evolve from blue to red are the reddest of the blue galaxies and green galaxies. • Color-density relation is not due to clusters! • Galaxies that host QSOs at z=1 reside in the same mass halos as typical DEEP2 galaxies and have blue host galaxies. • X ray-selected AGN cluster like red galaxies at z=1 - at later stage in evolution from QSOs? • Place strong constraints on QSO/AGN formation models.