Download
1 / 8
80 likes | 176 Views
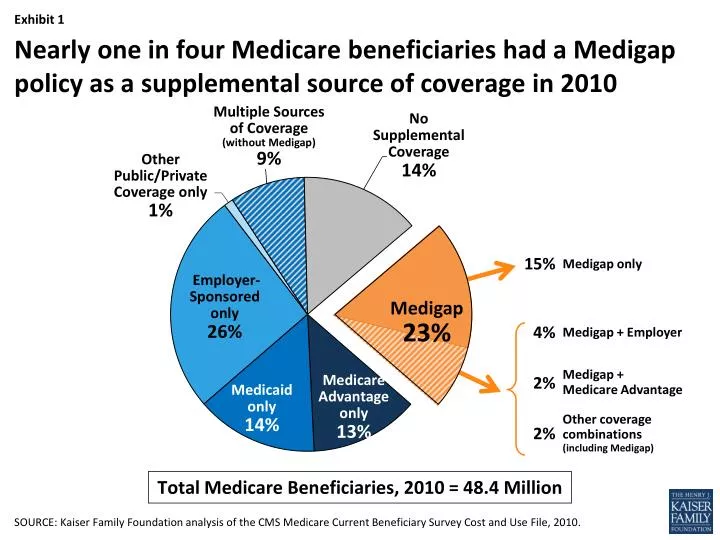
Nearly one in four Medicare beneficiaries had a Medigap policy as a supplemental source of coverage in 2010. Multiple Sources of Coverage (without Medigap) 9%. Other Public/Private Coverage only 1%. Total Medicare Beneficiaries, 2010 = 48.4 Million.

E N D
Nearly one in four Medicare beneficiaries had a Medigap policy as a supplemental source of coverage in 2010 Multiple Sources of Coverage (without Medigap) 9% Other Public/Private Coverage only 1% Total Medicare Beneficiaries, 2010 = 48.4 Million SOURCE: Kaiser Family Foundation analysis of the CMS Medicare Current Beneficiary Survey Cost and Use File, 2010.
Percent of Medicare Beneficiaries with Medigap by State, All Plans, 2010 National Average = 23% NOTE: Analysis excludes California, as the majority of health insurers do not report their data to the NAIC. Analysis includes standardized plans A-N, policies existing prior to federal standardization, plans in Massachusetts, Minnesota, and Wisconsin that are not part of the federal standardization program, and plans that identified as Medicare Select; excludes plans where number of covered lives was less than 20. Number of Medigap policyholders as of December 31, 2010, as reported in the NAIC data. SOURCE: K. Desmond, T. Rice, and Kaiser Family Foundation analysis of 2010 National Association of Insurance Commissioners (NAIC) Medicare Supplement data. Kaiser Family foundation and Mathematica Policy Research analysis of CMS State/County Market Penetration Files.
Distribution of Income of Medicare Beneficiaries, by Source of Supplemental Coverage, 2010 NOTE: Numbers do not sum due to rounding. SOURCE: Kaiser Family Foundation analysis of the CMS Medicare Current Beneficiary Survey Cost and Use File, 2010.
EXHIBIT 4 Share of Medicare Beneficiaries withMedigap Plans C and F, 2010 National Average = 12% SOURCE: K. Desmond, T. Rice, and Kaiser Family Foundation analysis of 2010 National Association of Insurance Commissioners (NAIC) Medicare Supplement data.
Share of Medigap Policyholders by All Plan Types, 2010 Total Number of Medigap Policyholders, 2010= 9.3 million NOTE: Analysis excludes California, as the majority of health insurers do not report their data to the NAIC. Analysis includes standardized plans A-N, policies existing prior to federal standardization (PreStandardization), and plans in Massachusetts, Minnesota, and Wisconsin that are not part of the federal standardization program; includes plans that identified as Medicare Select; excludes plans where number of covered lives was less than 20. Number of Medigap policyholders as of December 31, 2010, as reported in the NAIC data. SOURCE: K. Desmond, T. Rice, and Kaiser Family Foundation analysis of 2010 National Association of Insurance Commissioners (NAIC) Medicare Supplement data.
Distribution of Monthly Medigap Premiums, Plans A – J, 2010 90th percentile National average premium 10th percentile NOTE: Analysis excludes California, as the majority of health insurers do not report their data to the NAIC. Analysis includes standardized plans A-J; excludes plans K-L because of the small number of policyholders enrolled in these plans; excludes policies existing prior to federal standardization; excludes plans in Massachusetts, Minnesota, and Wisconsin; excludes plans that identified as Medicare Select; excludes plans where number of covered lives was less than 20. SOURCE: K. Desmond, T. Rice, and Kaiser Family Foundation analysis of 2008-2009 National Association of Insurance Commissioners (NAIC) Medicare Supplement data.
Average Monthly Medigap Premiums for Plan F, by State, 2010 National Average = $181 NOTE: Analysis excludes California, as the majority of health insurers do not report their data to the NAIC. Analysis includes standardized plan F; excludes plans that identified as Medicare Select; excludes plans where number of covered lives was less than 20. SOURCE: K. Desmond, T. Rice, and Kaiser Family Foundation analysis of 2008-2009 National Association of Insurance Commissioners (NAIC) Medicare Supplement data.
Table A2 Standard Medigap Plan Benefits, 2013 NOTES: Check marks indicate 100 percent benefit coverage. Amount in table is the plan’s coinsurance amount for each covered benefit after beneficiary pays deductibles or cost-sharing amounts, where applicable. The Affordable Care Act eliminated cost-sharing for preventive benefits rated A or B by the U.S. Preventive Services Task Force, effective 2011. 1After June 1, 2010, Medigap Plans E, H, I, and J are no longer available for purchase by new policyholders; existing policyholders may remain in these plans. 2Benefits for Plan G reflect the standard benefit after June 1, 2010 (Part B excess charges changed from 80% to 100%). 3Medigap Plans K and L available for purchase in 2005. 4Medigap Plans M and N available for purchase after June 1, 2010. *Plan N pays 100% of the Part B coinsurance except up to $20 copayment for office visits and up to $50 for emergency department visits. SOURCE: Centers for Medicare & Medicaid Services, 2013 Guide to Health Insurance, February 2013.